
A report in Aranda QUERY MANAGER is a tool that allows you to generate and manage consolidated reports with outstanding information about your business processes in the Aranda Software tools.
Quick reports allow you to create data sheets quickly and efficiently by selecting the information you need.
Creating Quick Reports
⚠ Important requirements:
- You must have previously set up a Folder
- You must have previously set up a Data Source
1. Enter the main reporting section.
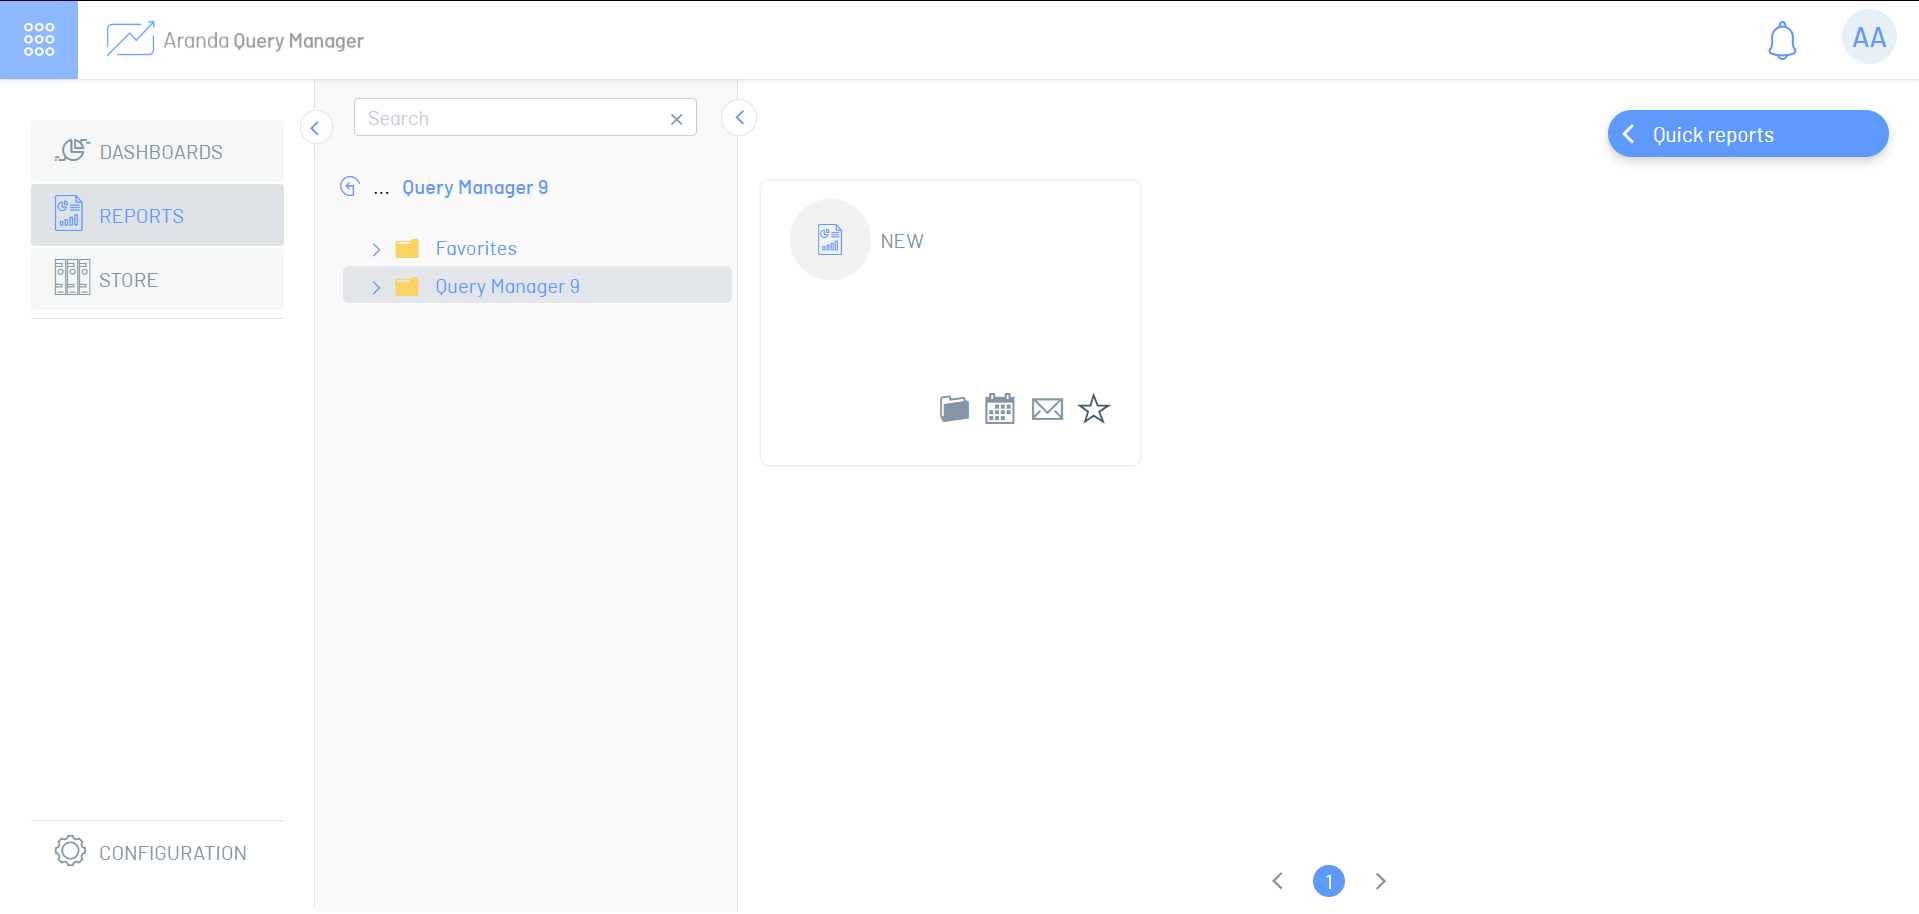
2. Select the folder where you want to create the quick report; The custom reports contained in the selected folder will be listed.
3. Click the Quick Reports in the upper-right corner.
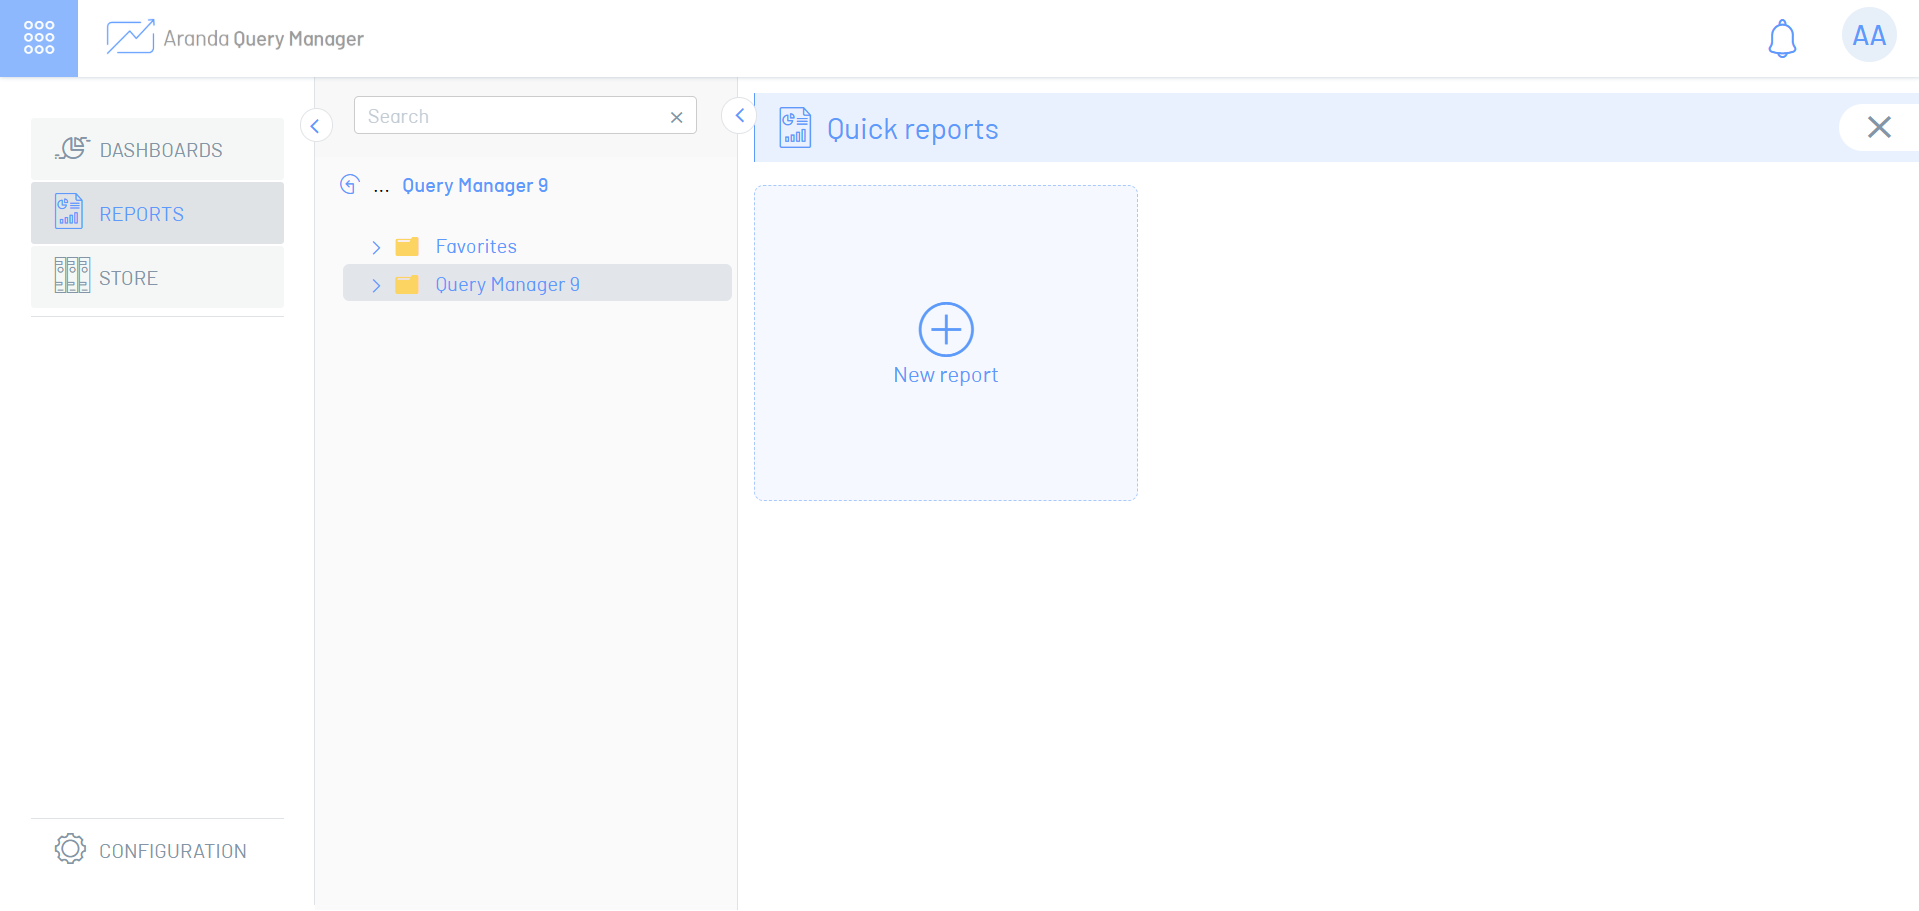
4. In the new window, the quick reports are listed; You can open or delete Quick Reports created from this window. Select the option to New report to create a new one and move to the blank report workspace.
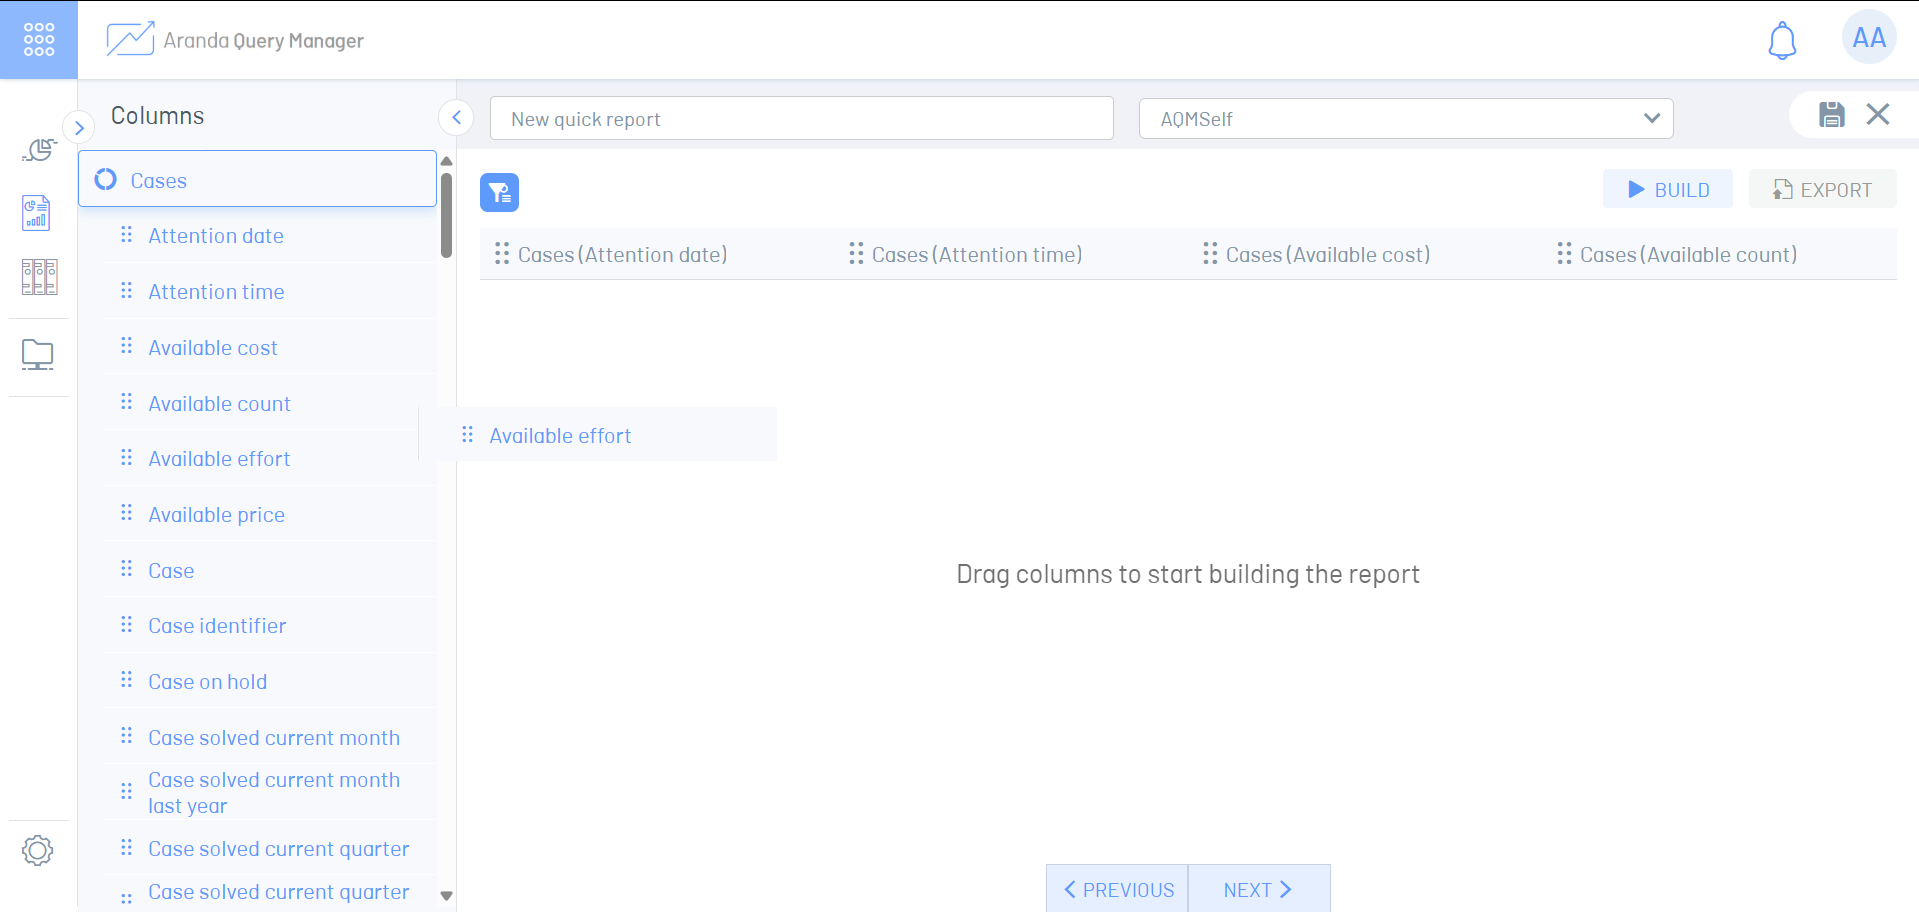
5. At the top of the workspace, specify the name and data source of the report.
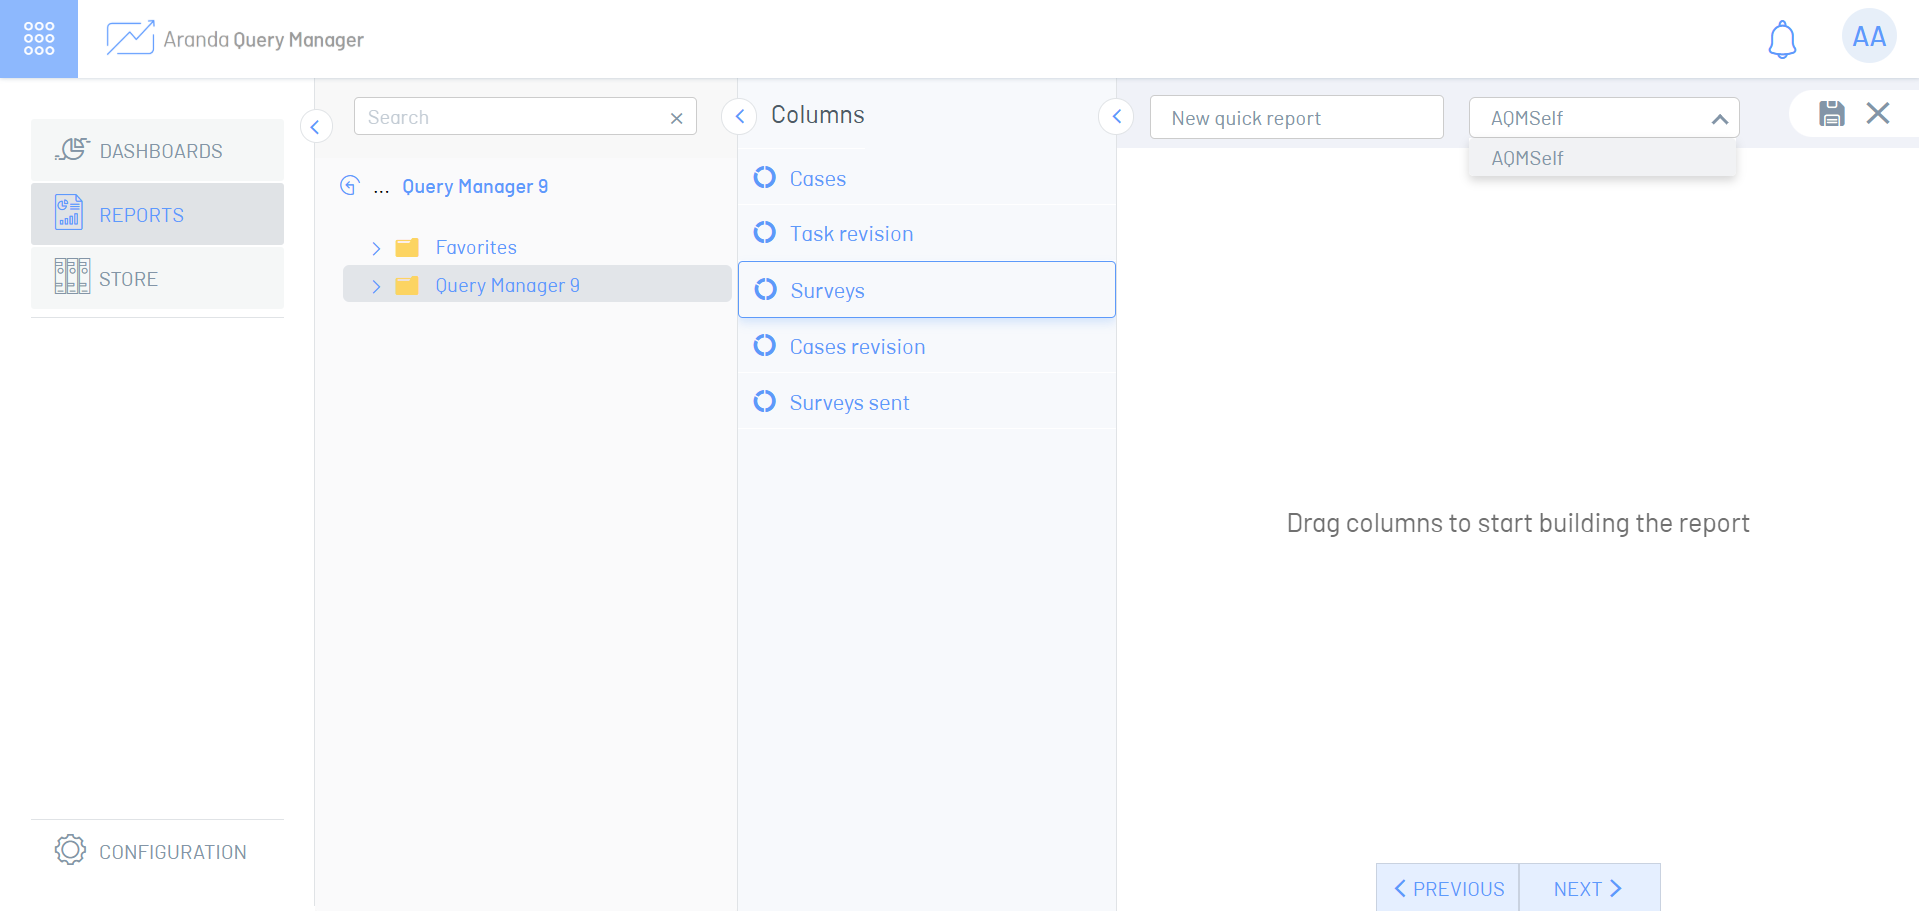
6. In the section on the left you can find the Data Models, its Dimensions, Columns and Additional fields which you can unfold, drag, and drop into the workspace.
⚐ Note:
- You may not mix the Dimensions, Columns or Additional fields of different Data Models.
- By dragging and dropping columns, required fields are added for each Data model. These fields cannot be removed from the layout.
7. Optionally You can make use of the Column Options To change the order in which they are displayed, rename the column, delete a column, or delete all columns.
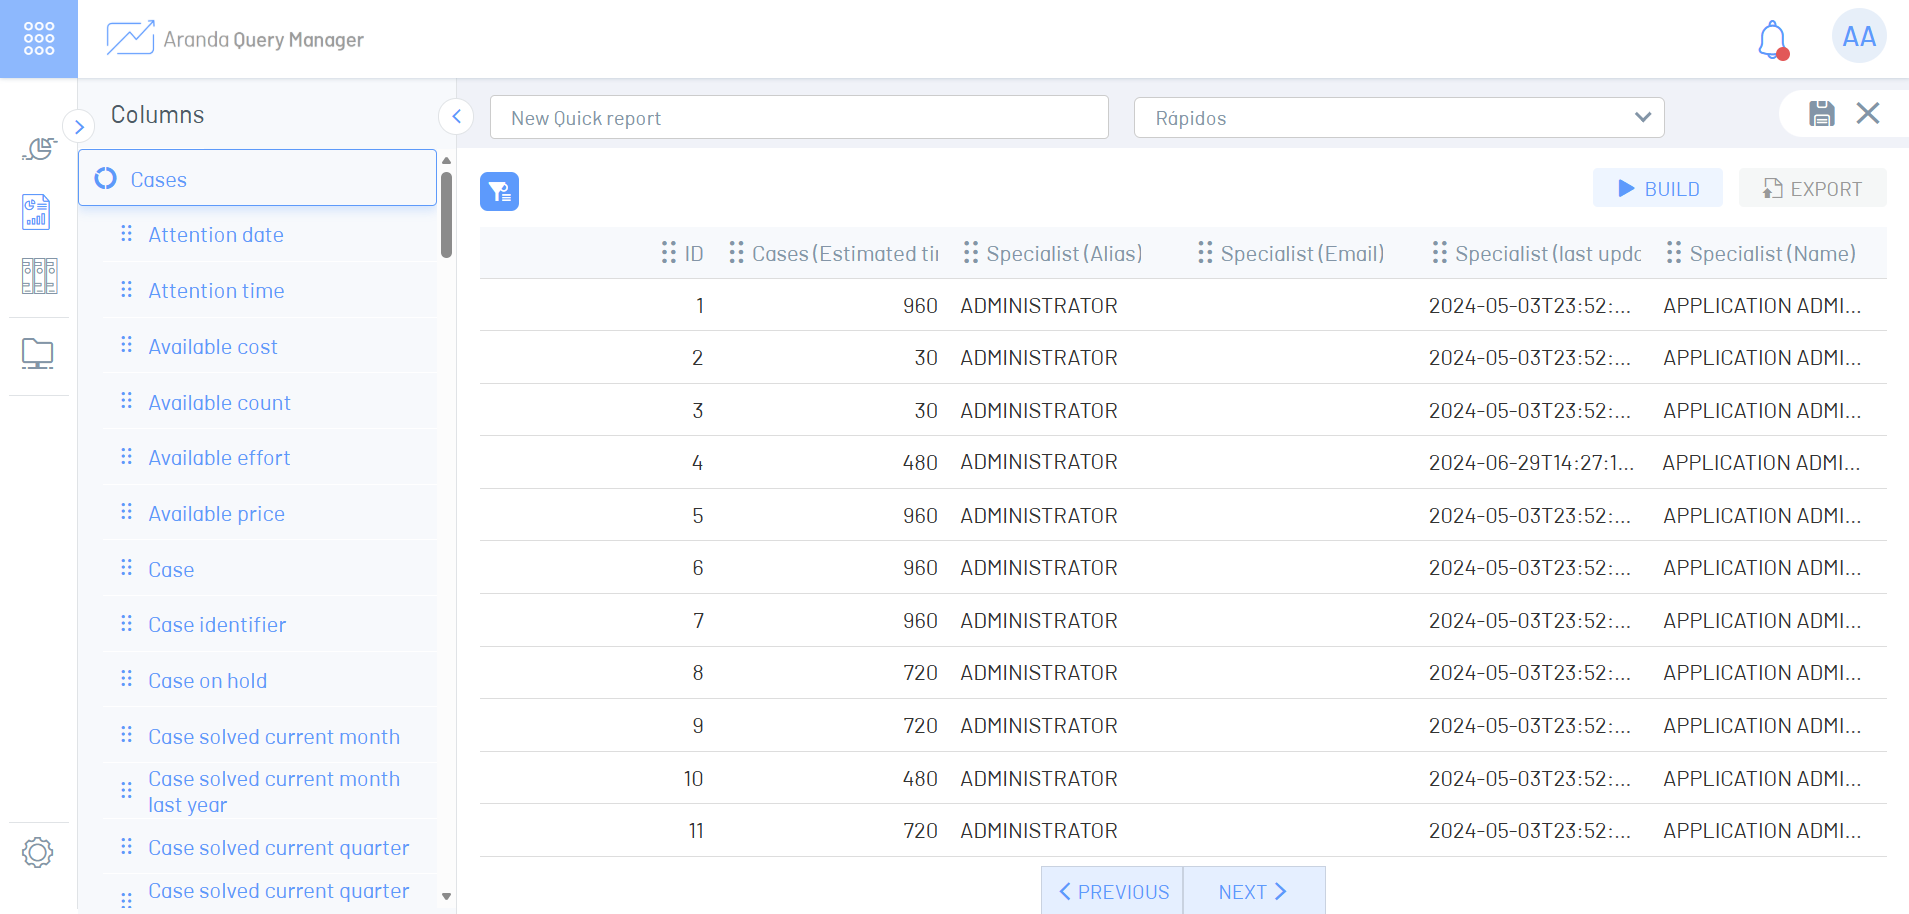
8. Click the Generate  to run the report and show the sheet with the requested information.
9. Once all the changes are made, click on the  to save the report.
Discharge
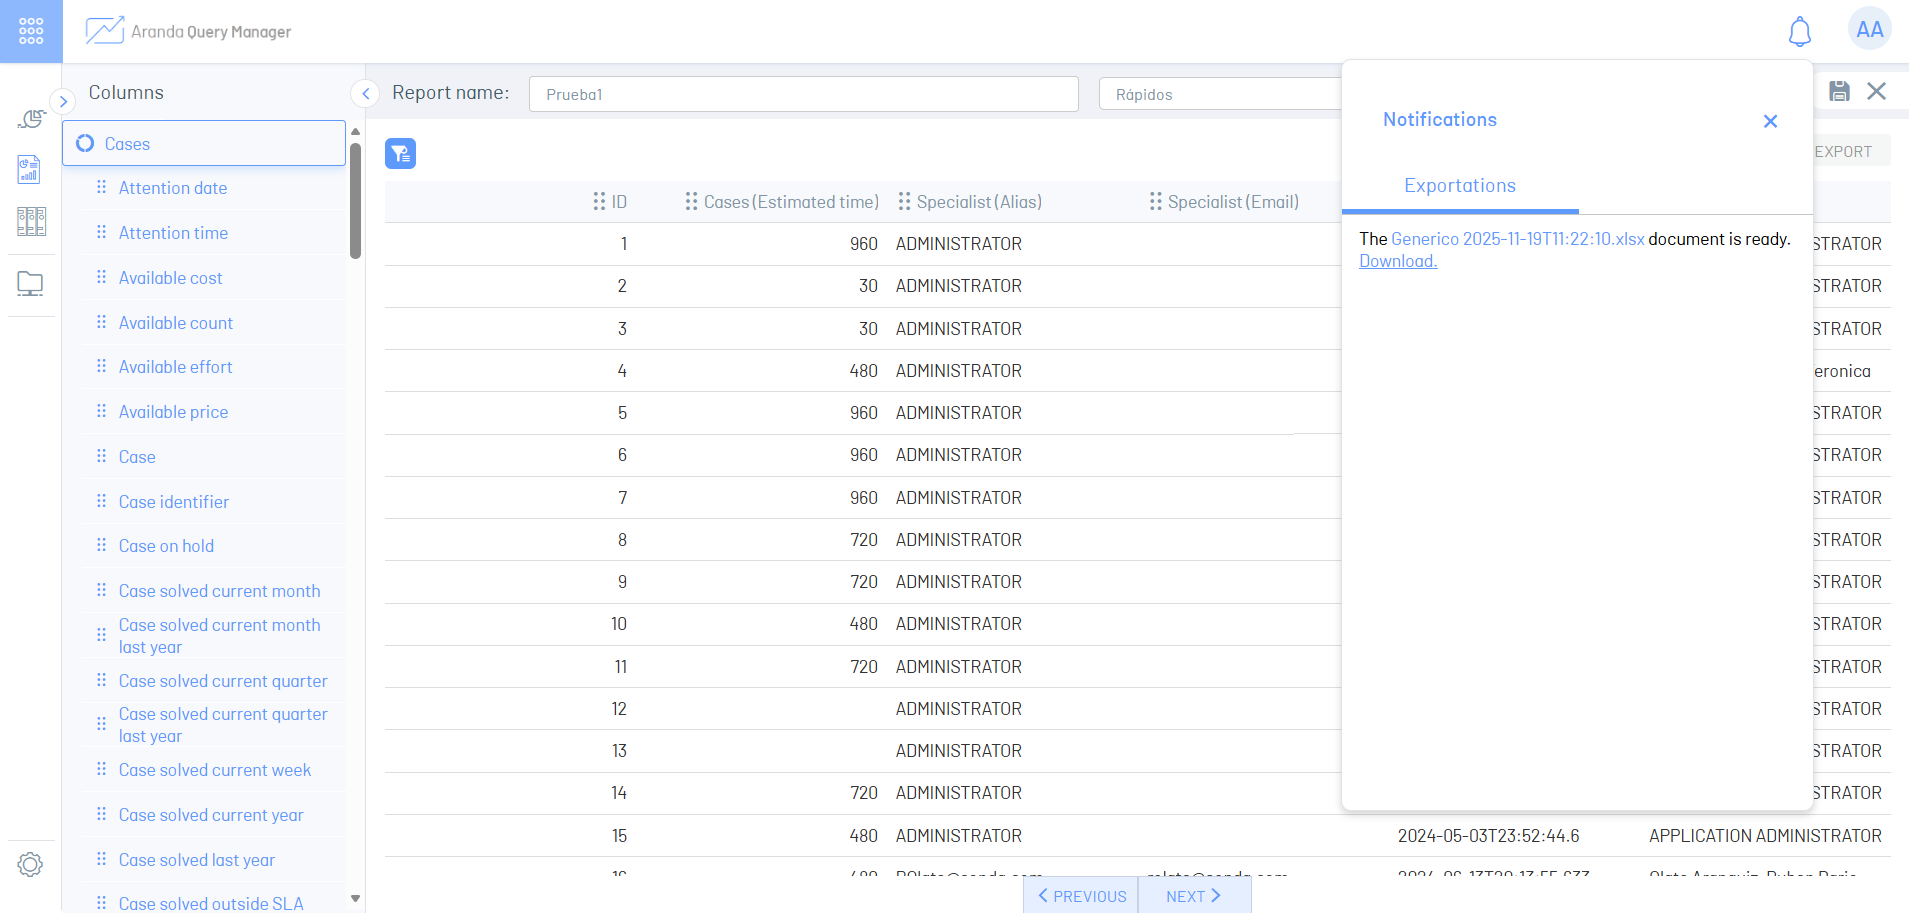
You can click on the report export button  to download the information in a .xlsx format file that extracts information up to a maximum of ten thousand (10,000) records.
You can click on the bell icon  at the top right of the screen that will notify you once the report is ready to download.
Additional fields
Select the option Additional within a Data model to add additional fields.
1. Click on the option Additional  listed in the columns of the Data model
2. In the window Add additional fields Type the name of the additional field to be added to your report and press Enter to display the matching fields.
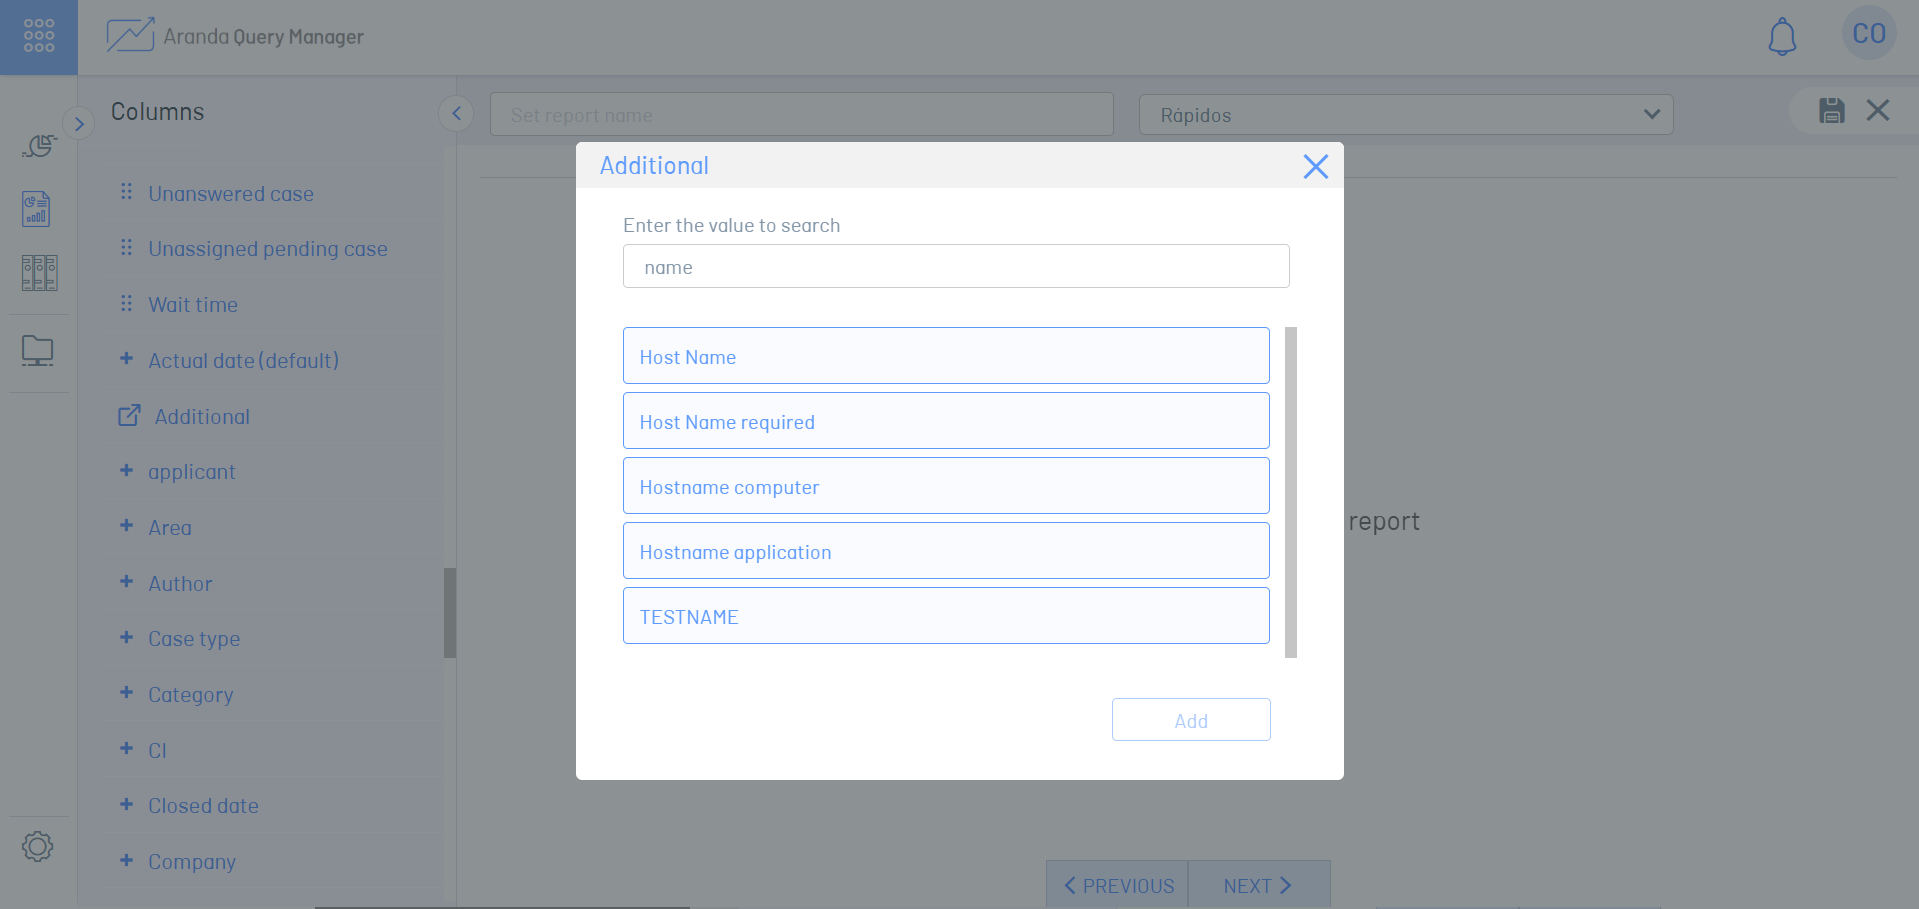
3. Select the additional field and click the Add.
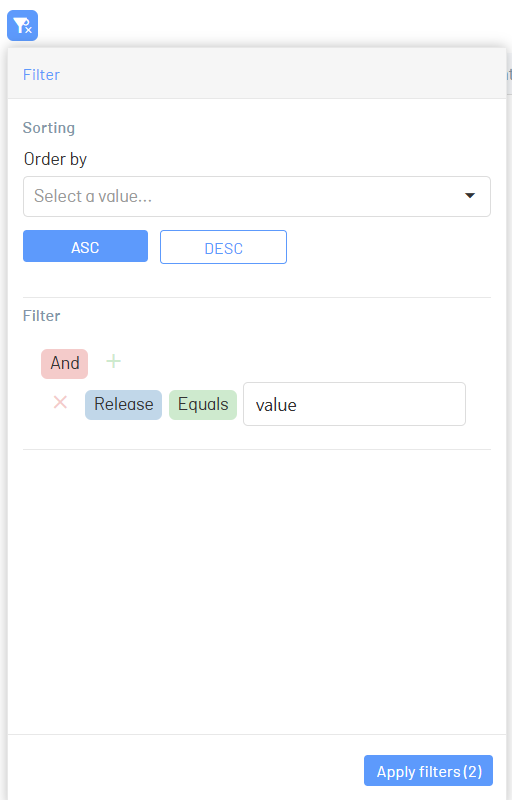
Sorting and filters
Ordering
The information displayed when generating the report is sorted by the identifier in descending numbers, but you can also indicate sorting the information by other columns.
1. Once you have provided the columns that you want to view in the workspace, click the  to open the Sorting & Filters settings menu.
2. Deploy the field Sort by and select the column you want to sort the information with.
3. Select the order Ascendant or Descending
4. Click the  to save the changes made to the legal system.
5. Click the Generate to run the report and show the sheet with the ordered information.
Filters
Apply filters to columns to display information as required.
1. Once you have provided the columns that you want to view in the workspace, click the to open the Sorting & Filters settings menu.
2. Click the  to add a filter.
3. Select the column, logical operator, and value by which you want to filter the information.
4. Click the to save changes made to filters.
5. Click the Generate to execute the report and show the sheet with the leaked information.
{#fileds-options} column options
They allow you to edit the layout of the report workspace according to your criteria.
1. Change column order: Allows you to drag and drop columns within the workspace to display the column of your choice first.
2. Rename fields: It allows you to rename the columns by right-clicking on the name of the column, and selecting the option of Rename.
3. Delete a column: Allows you to delete the selected column from the workspace.
4. Delete all columns: Allows you to delete all columns from the workspace.
Displacement
The paginated report information shows by default the first fifty (50) records found, once this limit is exceeded, the buttons to navigate to the next page or the previous page are enabled. When navigating to a new page either forward or backward, each page will display a maximum of fifty (50) records.
⚐ Note: The Data Models, Dimensions and Columns they have translations in supported languages.