
A dashboard in Aranda QUERY MANAGER is a tool that allows you to graphically visualize the metrics required by the organization and facilitates the selection of relevant data and indicators, for analysis and intelligent business decision-making.
Quick dashboards allow you to create graphs and diagrams quickly and efficiently by selecting the information you need.
Creating Quick Boards
⚠ Important requirements:
- You must have previously set up a Folder
- You must have previously set up a Data Source
1. To create the Quick Boards, log in to the AQM Web Console, in the Information View. Boards.
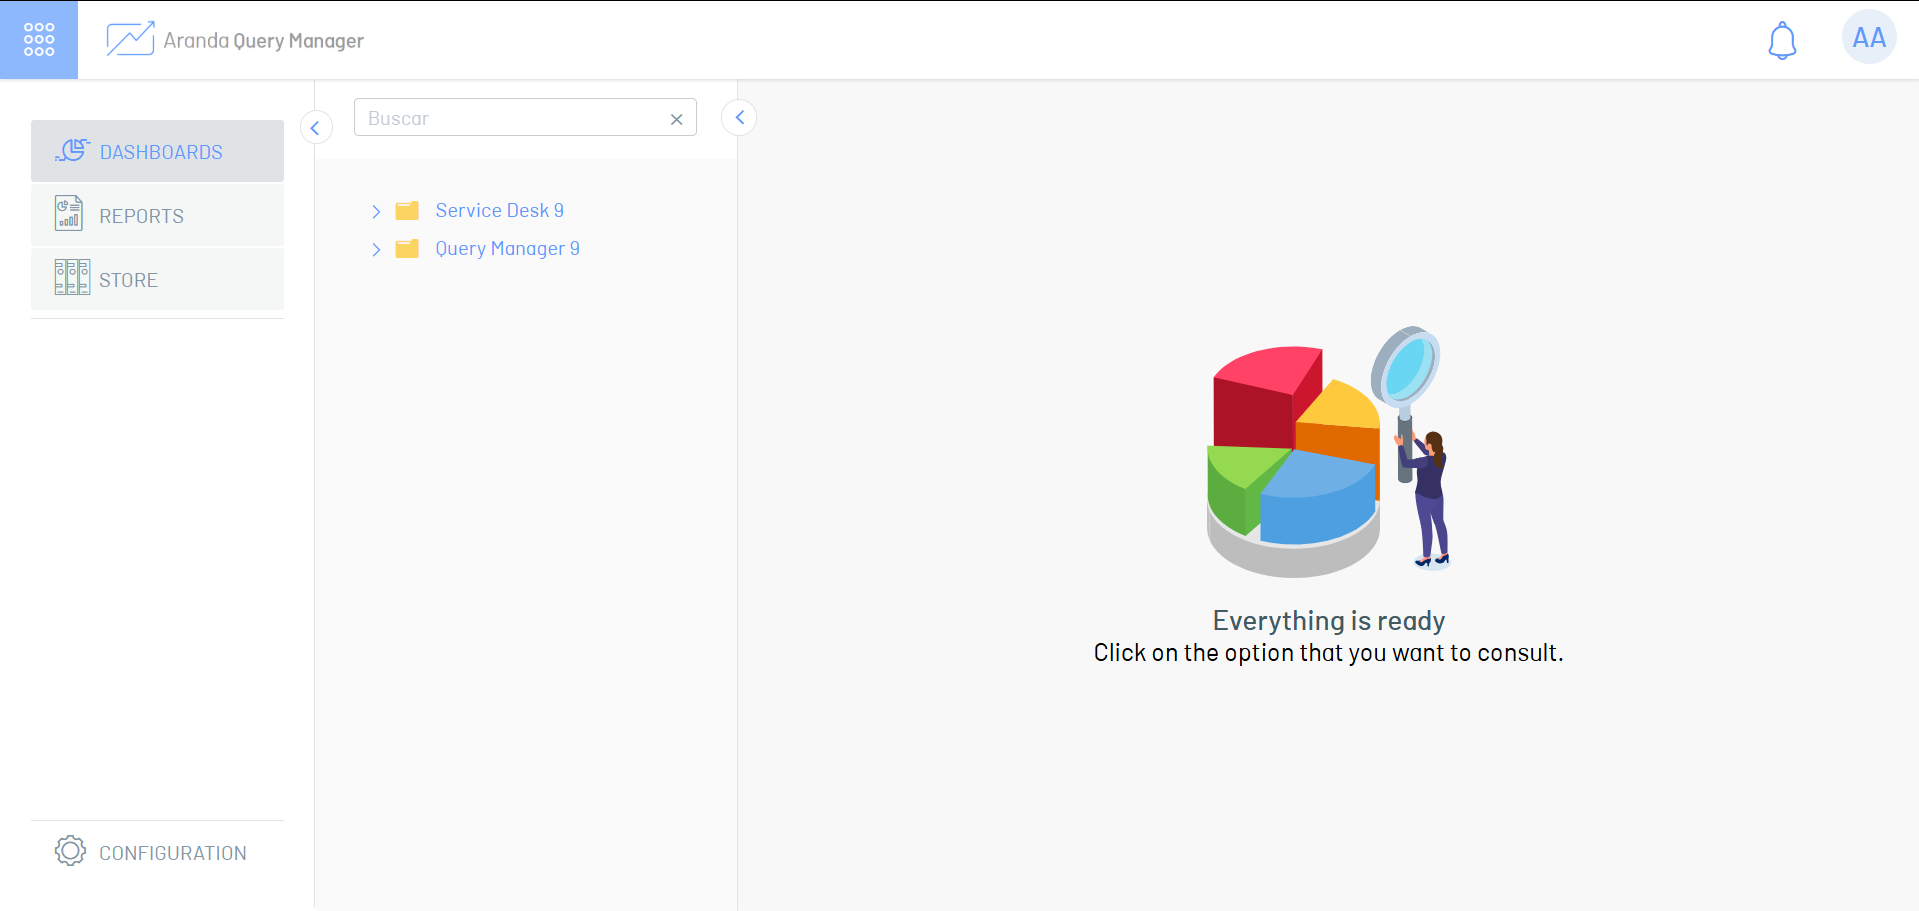
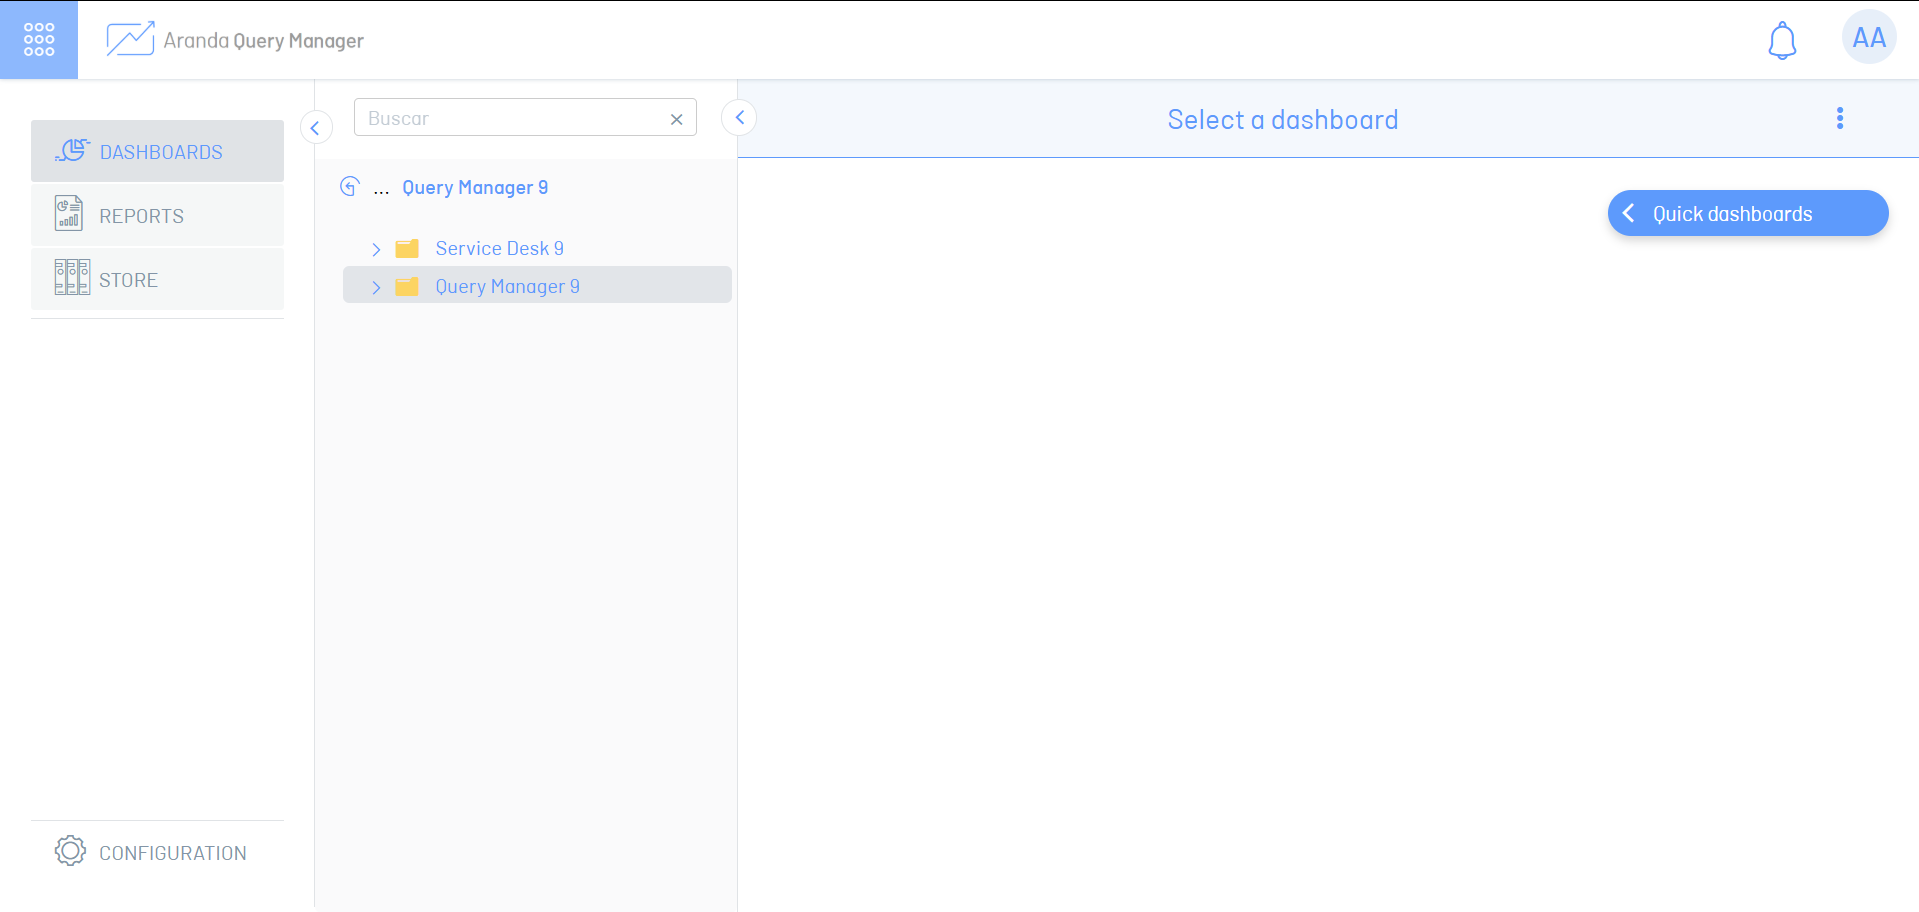
2. Select the folder where you want to create the quick board; The custom boards contained in the selected folder will be listed.
3. Click the Quick Boards from the list of custom boards.
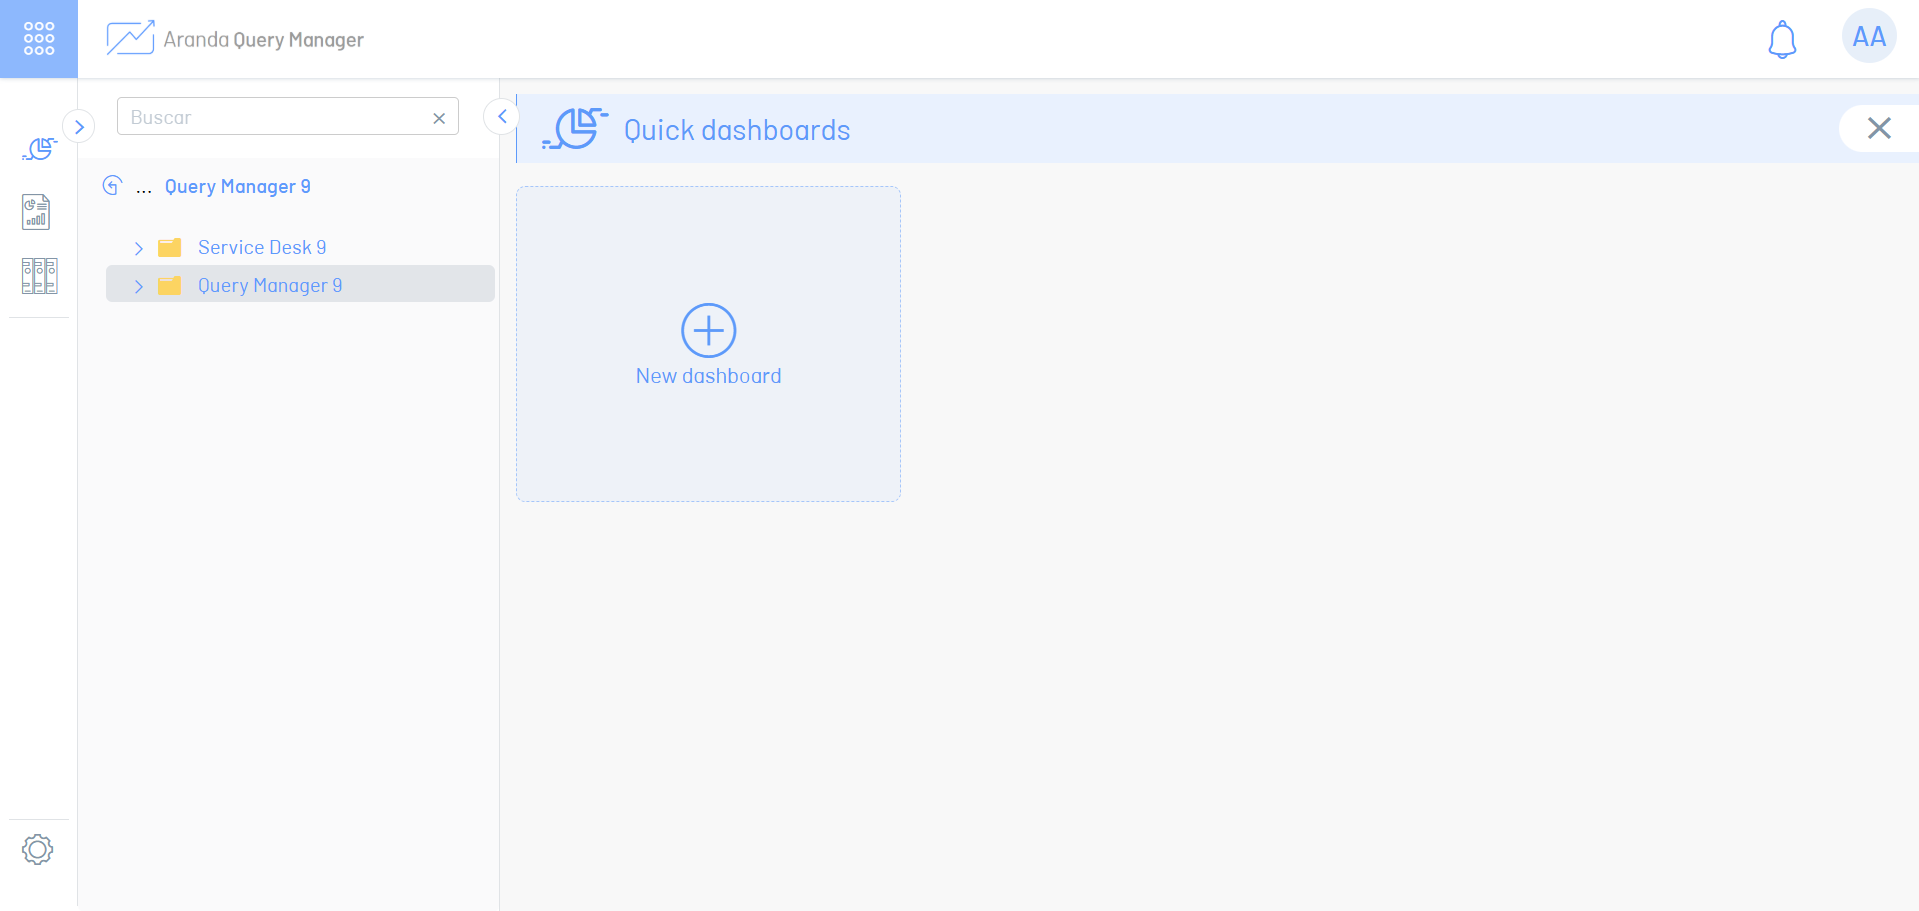
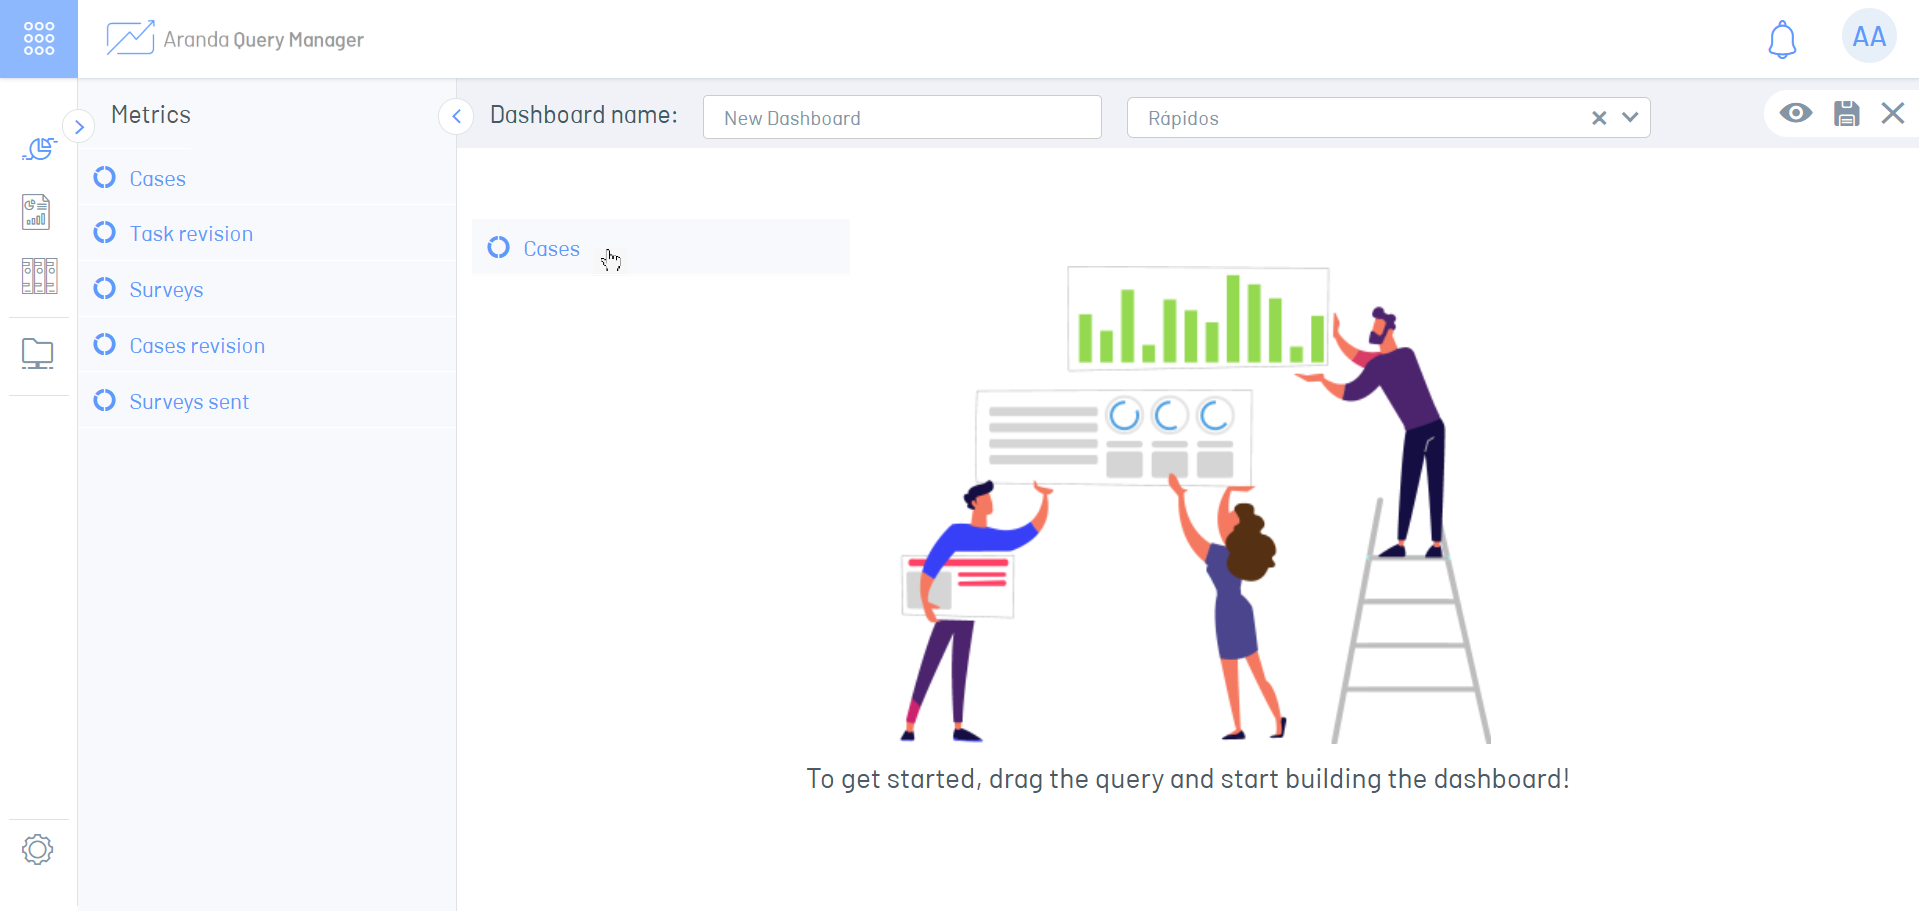
4. In the new window, the quick boards are listed; You can open or delete Quick Boards created from this window. Select the option to New dashboard to create a new one and move to the blank board workspace.
5. At the top of the workspace, specify the name and data source of the dashboard.
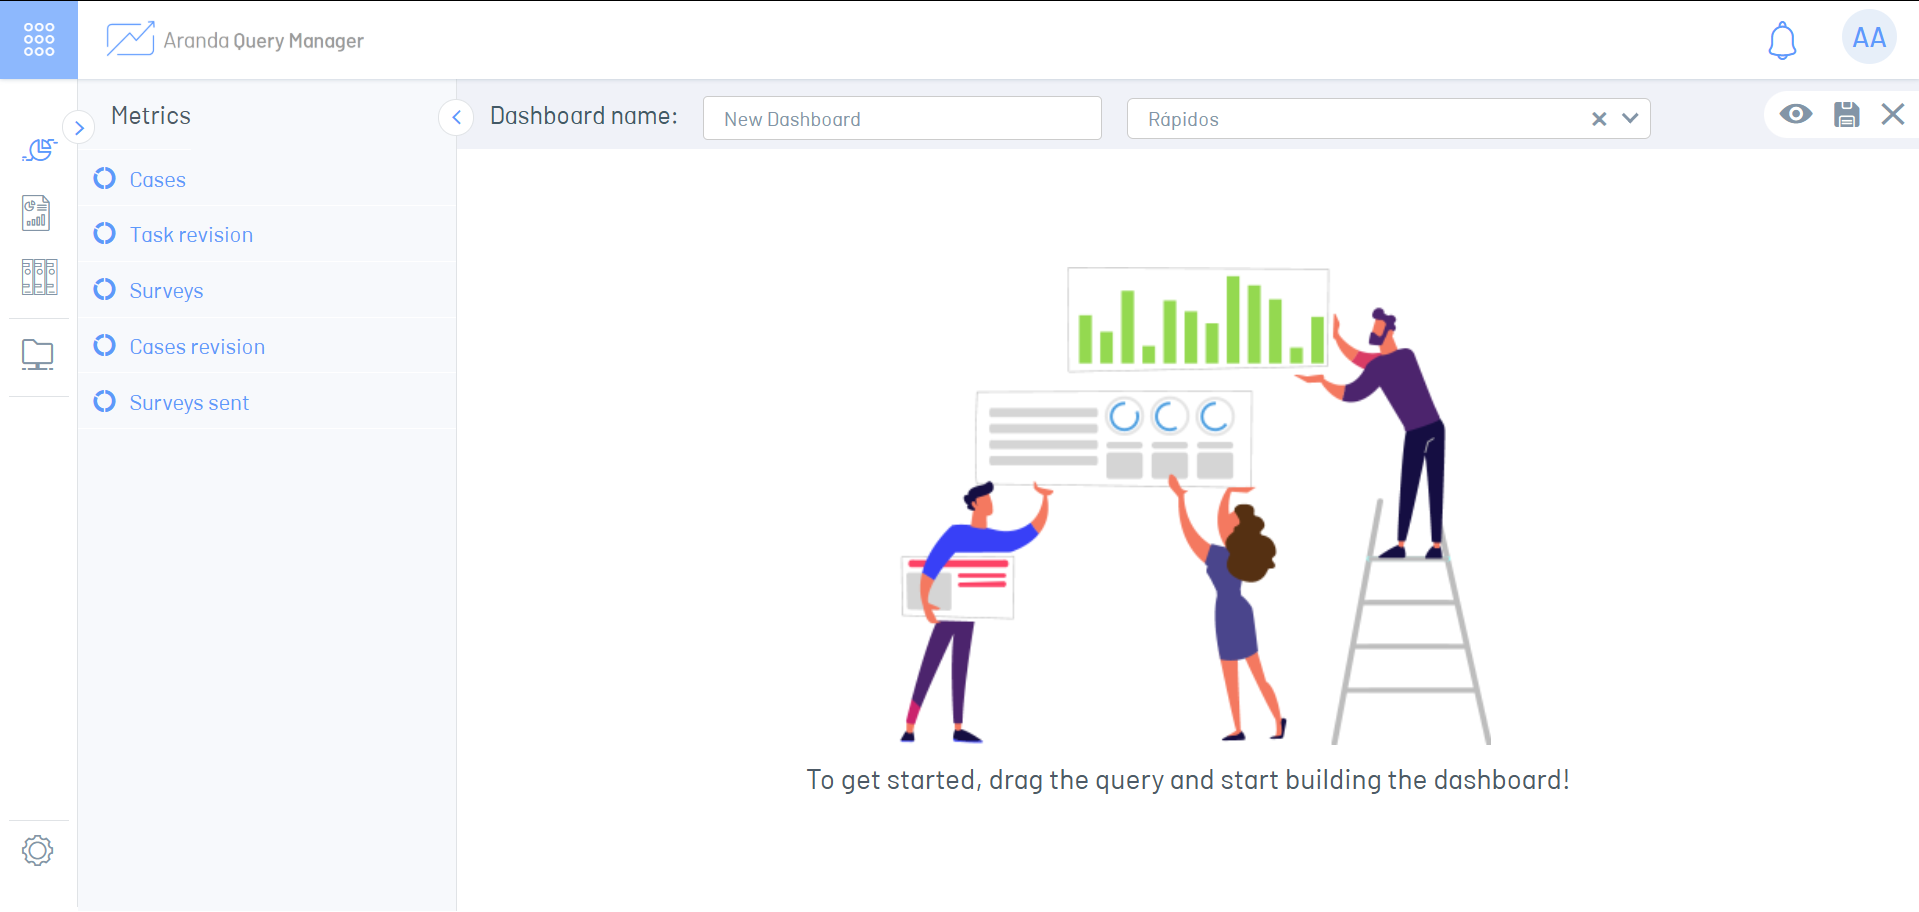
6. In the Metric You can find the Data Models, which you can drag and drop into the workspace to open the query creation window.
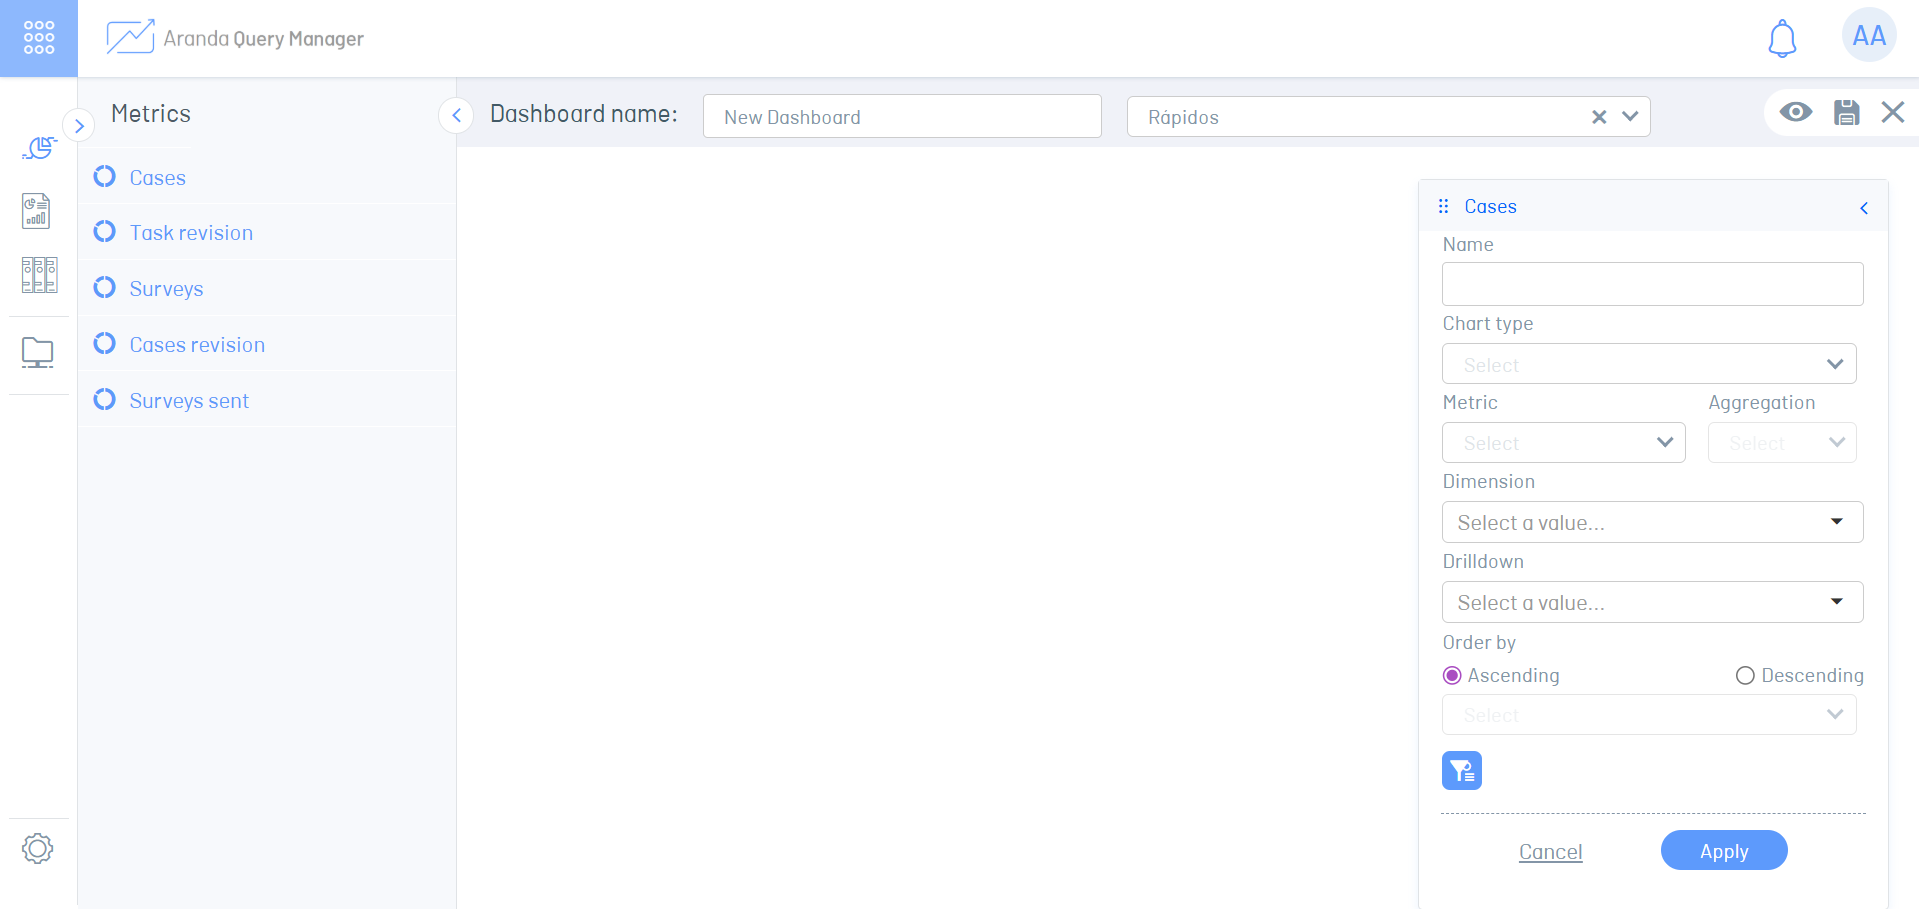
7. In the query creation window, you can add the following information to each of your fields:
| Field | Description |
|---|---|
| Name | Specify a name for the chart. |
| Chart Type | Select the chart type; Cake, bar, doughnut, area. |
| Metric | Specify one of the metrics that are enabled based on the Data Models on which he is working. |
| Aggregation | Specify an aggregation based on the Data Models on which he is working. |
| Dimension | Specify the column you want to query in the Data Models. |
| Drilldown | Opional. Define the column by which you want to break down the chart when you click on any of the sections of the chart. |
8. Click the Apply to save and display chart changes.
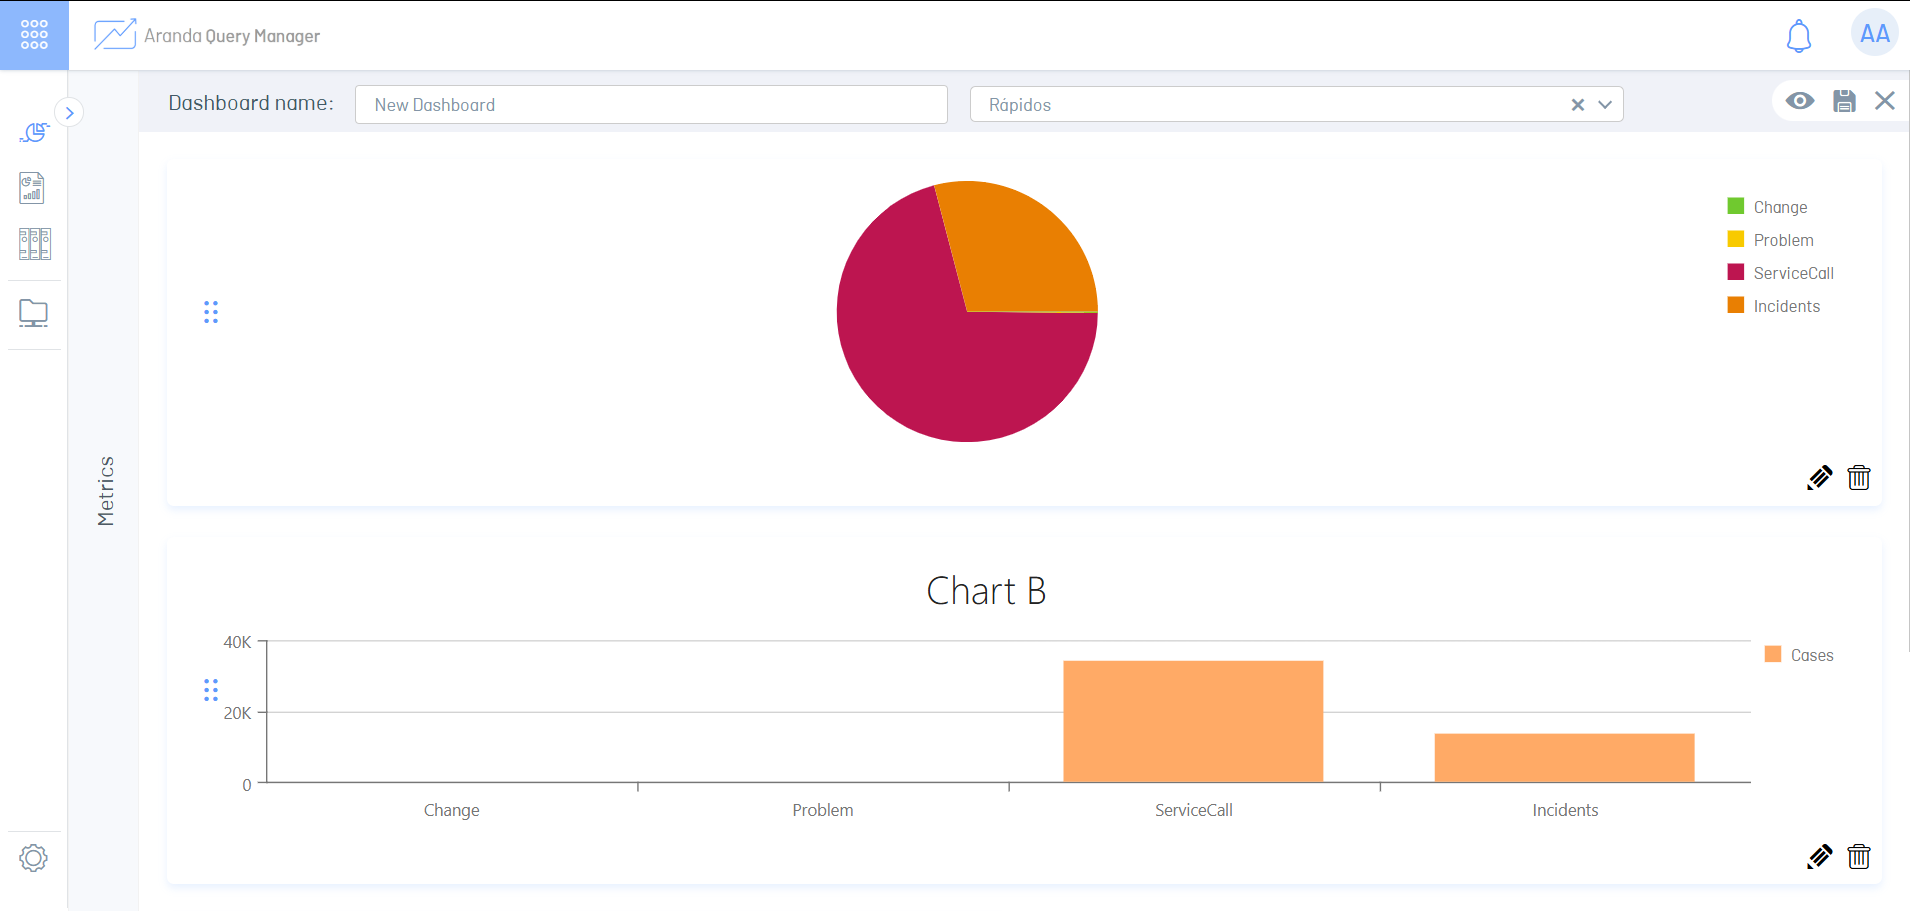
9. To create more than one chart, replicate the previous process. Once all the changes are made, click on the  to store the board.
Types of charts
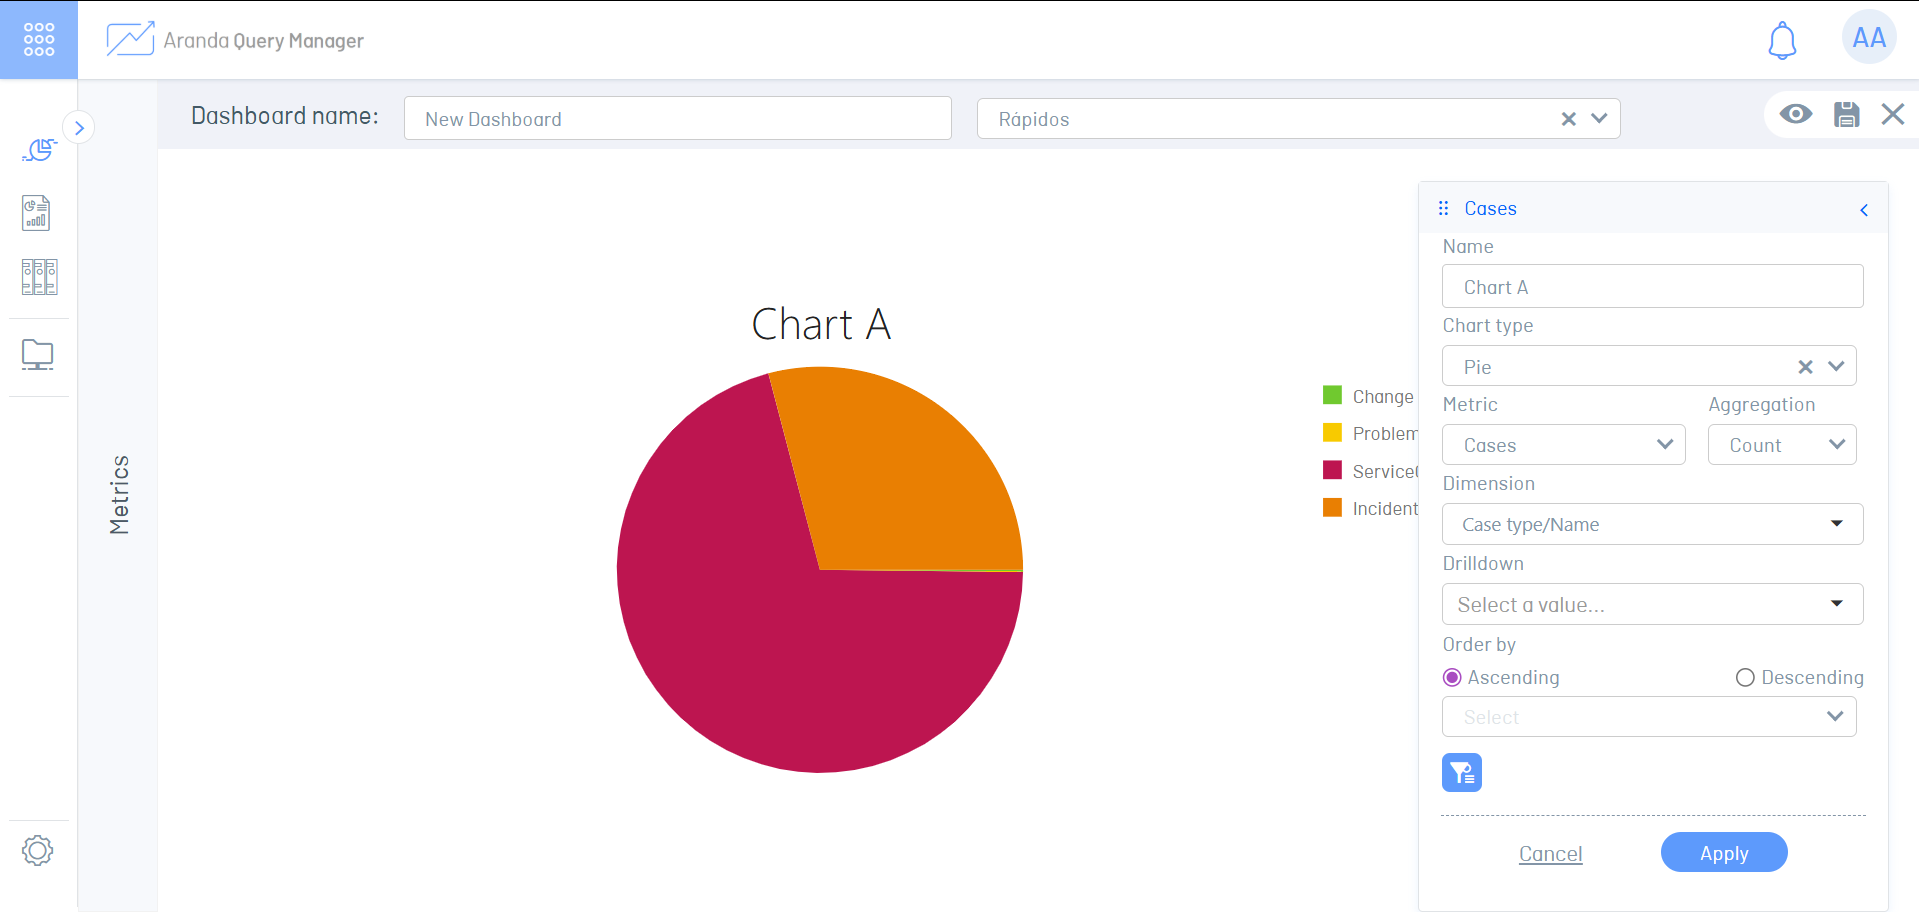
Pie chart
| Option in the form | Description | Use in chart creation |
|---|---|---|
| Name | Chart name. | Specify a name for the chart. |
| Metric | A set of attributes that can be calculated. | Select a Metric from a data model. |
| Aggregation | Calculate the metric with operations predetermined by the application. | Select an aggregation. Note:It is normal that not all aggregations (Count, Sum, average) are seen. |
| Dimension | These are the attributes that are part of the metric. | Select an attribute from the list. There are dimensions that can have an additional attribute level. |
| Sorting Directorate | Indicates the direction in which the data is sorted when displayed. | Select the sort direction Ascending or Descending. |
| Sorting by column | Sort the information by a column. | Select the column that requires sorting. |
| Drilldown | Allows you to click on a portion of the chart to drill down into the information. | Select a column that requires further |
| Filters | It allows you to filter information by columns. | For more information see Filter menu |
| Data grouping | Default The graphs group the first 10 records. This option allows you to group the data that is not displayed, in a label in the visualization called Other. | Enable or disable grouping. |
⚐ Example:
Bar Chart
| Option in the form | Description | Use in chart creation |
|---|---|---|
| Name | Chart name. | Specify a name for the chart. |
| Metric | A set of attributes that can be calculated. | Select a Metric from a data model. |
| Aggregation | Calculate the metric with operations predetermined by the application. | Select an aggregation. Note:It is normal that not all aggregations (Count, Sum, average) are seen. |
| Dimension | These are the attributes that are part of the metric. | Select an attribute from the list. There are dimensions that can have an additional attribute level. |
| Sorting Directorate | Indicates the direction in which the data is sorted when displayed. | Select the sort direction Ascending or Descending. |
| Sorting by column | Sort the information by a column. | Select the column that requires sorting. |
| Drilldown | Allows you to click on a portion of the chart to drill down into the information. | Select a column that requires further |
| Filters | It allows you to filter information by columns. | For more information see Filter menu |
| Data grouping | Default The graphs group the first 10 records. This option allows you to group the data that is not displayed, in a label in the visualization called Other. | Enable or disable grouping. |
| Chart orientation | Sort chart information horizontally or vertically. | Select the horizontal or vertical orientation of the chart. |
Donut Graphic
| Option in the form | Description | Use in chart creation |
|---|---|---|
| Name | Chart name. | Specify a name for the chart. |
| Metric | A set of attributes that can be calculated. | Select a Metric from a data model. |
| Aggregation | Calculate the metric with operations predetermined by the application. | Select an aggregation. Note:It is normal that not all aggregations (Count, Sum, average) are seen. |
| Dimension | These are the attributes that are part of the metric. | Select an attribute from the list. There are dimensions that can have an additional attribute level. |
| Sorting Directorate | Indicates the direction in which the data is sorted when displayed. | Select the sort direction Ascending or Descending. |
| Sorting by column | Sort the information by a column. | Select the column that requires sorting. |
| Drilldown | Allows you to click on a portion of the chart to drill down into the information. | Select a column that requires further |
| Filters | It allows you to filter information by columns. | For more information see Filter menu |
| Data grouping | Default The graphs group the first 10 records. This option allows you to group the data that is not displayed, in a label in the visualization called Other. | Enable or disable grouping. |
Area Chart
| Option in the form | Description | Use in chart creation |
|---|---|---|
| Name | Chart name. | Specify a name for the chart. |
| Metric | A set of attributes that can be calculated. | Select a Metric from a data model. |
| Aggregation | Calculate the metric with operations predetermined by the application. | Select an aggregation. Note:It is normal that not all aggregations (Count, Sum, average) are seen. |
| Dimension | These are the attributes that are part of the metric. | Select an attribute from the list. There are dimensions that can have an additional attribute level. |
| Sorting Directorate | Indicates the direction in which the data is sorted when displayed. | Select the sort direction Ascending or Descending. |
| Sorting by column | Sort the information by a column. | Select the column that requires sorting. |
| Filters | It allows you to filter information by columns. | For more information see Filter menu |
| Data grouping | Default The graphs group the first 10 records. This option allows you to group the data that is not displayed, in a label in the visualization called Other. | Enable or disable grouping. |
Sorting and query filters
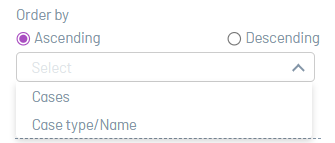
Ordering
The information presented when generating the dashboard is sorted by the identifier in descending order. You can also sort the information by other columns.
1. Once the metric to query in the workspace has been defined, select a column to sort in ascending or descending order, in the query creation window.
2. Click the  to save changes made to filters.
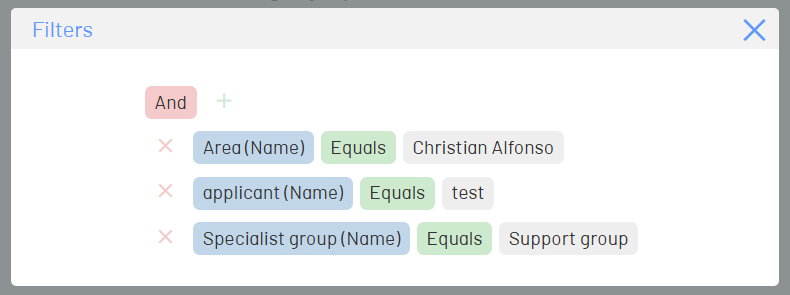
Filters
Apply filters to columns to display information as required.
1. Once the Metric to query in the workspace, click the  to open the Filters settings menu.
2. Click the  to add a filter.
3. Select the column, logical operator, and value by which you want to filter the information.
4. Close the filter settings menu and click the to save changes made to filters.
⚐ Note: Changes made to filters and sorts are updated in real-time.
About Visualization
- You can relocate the dashboard charts as required.
- Click the
 to view the dashboard at Display Mode, hiding buttons and focusing on the dashboard graphics.
 - The Data Models listed are different from those in Quick Reports. Some will not be listed when creating a board.
⚐ Note: The Data Models, Dimensions and Columns they have translations in supported languages.