
This editor allows you to customize and configure the information in the consolidated reports of the business processes, making use of different controls and filters to organize and present the information graphically
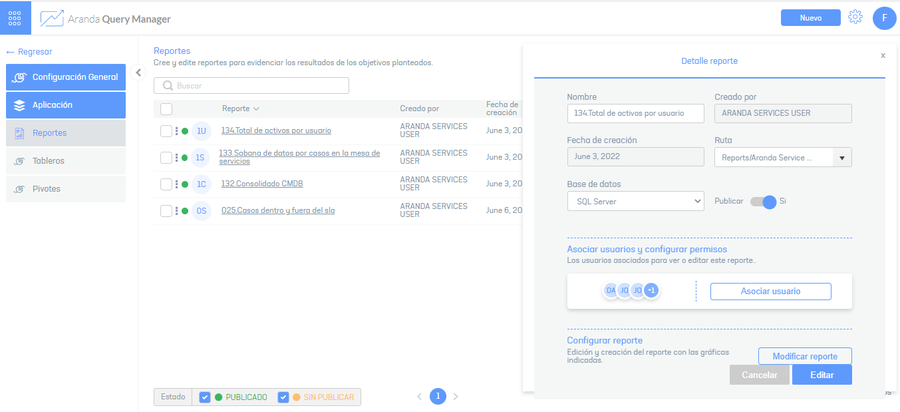
1. To access the Report Designer, log in to the AQM Configuration Console, in the Application From the main menu, select a record from the list of existing reports, and in the Detail view, click the Modify Report.
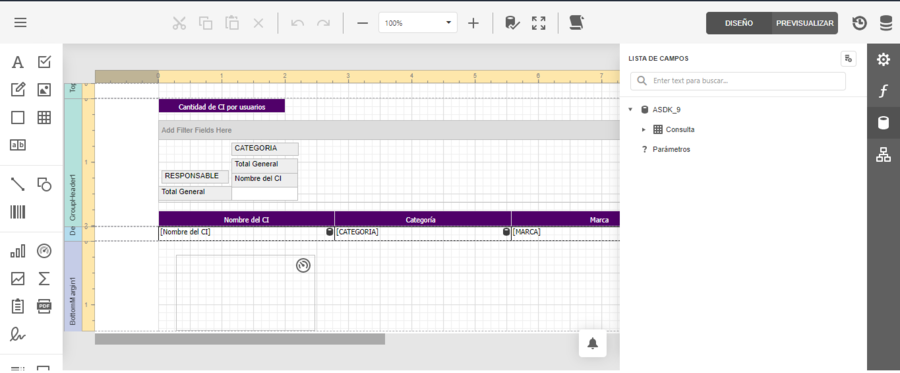
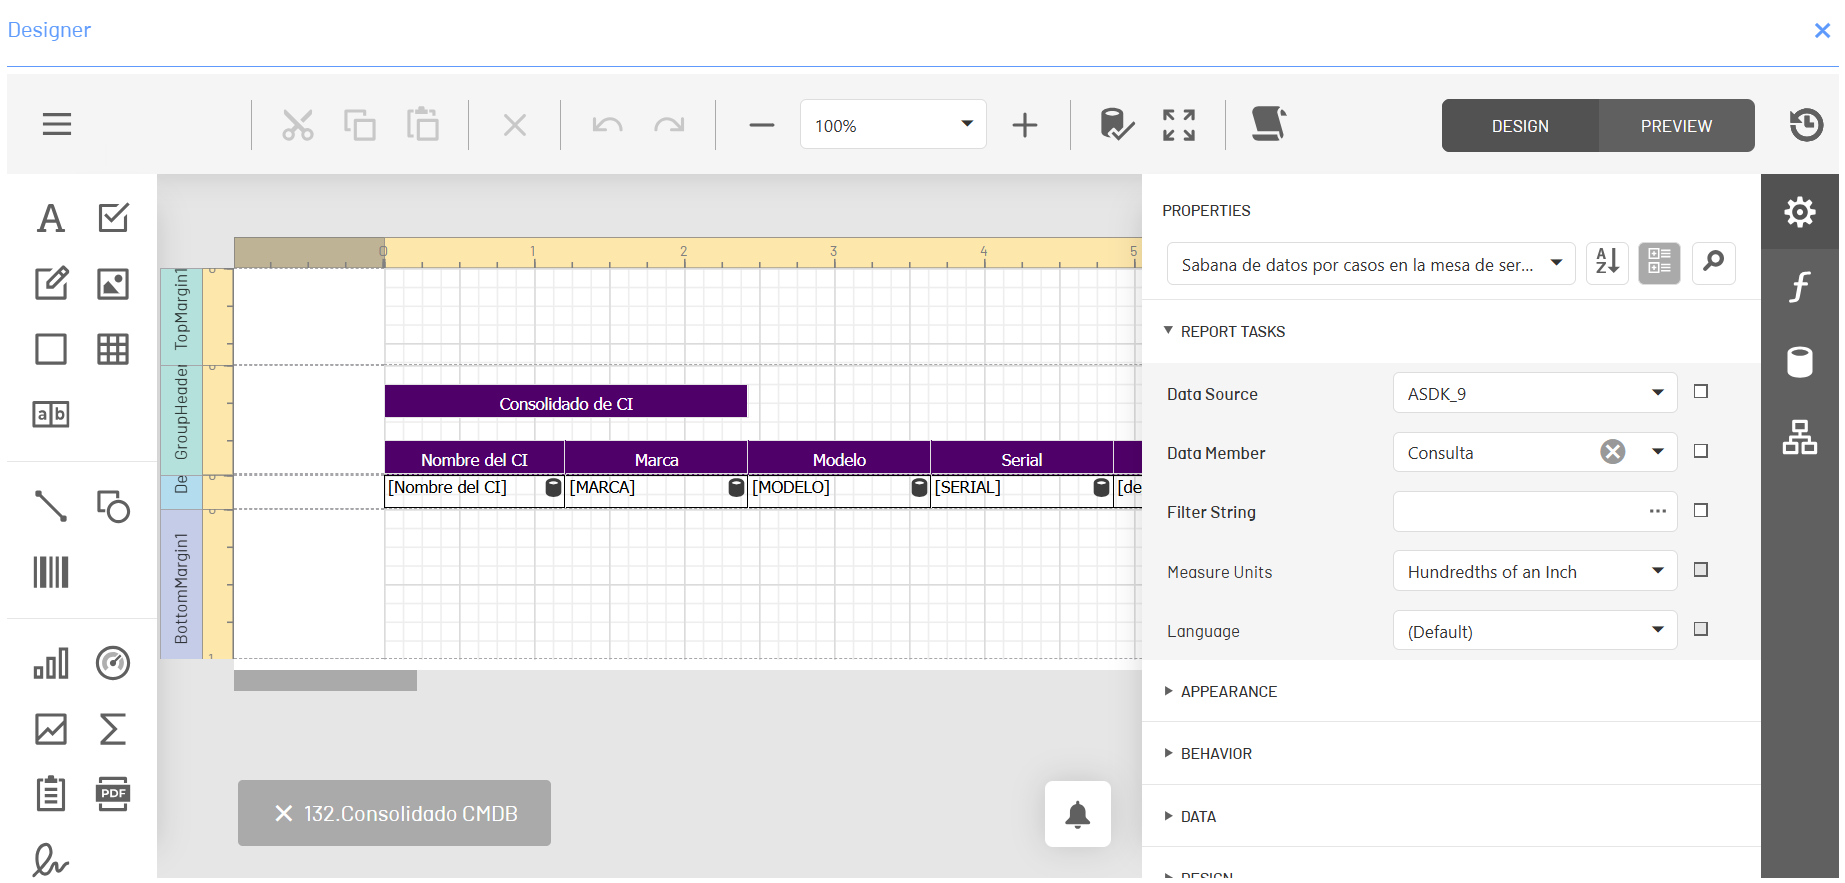
2. The report designer is enabled where you can customize the information generated. In the main menu of the designer you can see different controls to organize the information in the report and in the report view you can use the different controls.
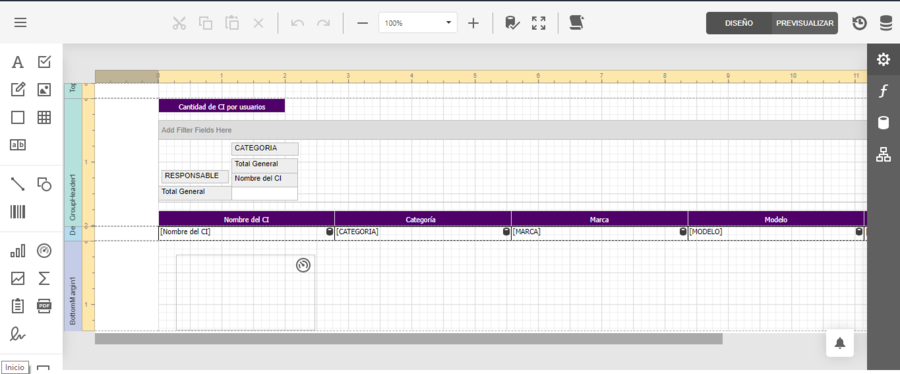
3. To design a report, select the control of your preference from the main menu and scroll it to the Designer Reports view.
Controls
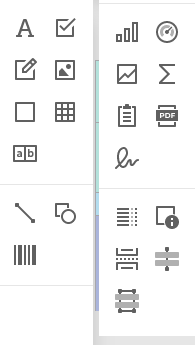
The controls in the report designer are grouped into categories that allow you to design and customize the report with different characteristics.
| Control Type | Description |
|---|---|
| Common | This category groups the information display controls such as: Label, checkbox, rich text, image box, panel, table, and character comb. |
| Forms | This category groups the controls that present the information such as:Line, Shape, and Barcode. |
| Graphic | This category groups the controls for presenting information, such as: Graphic, gauge, sparkline, cross tab, sub report, pdf content, pdf signature |
| Organize | This category is made up of controls to organize information such as: table of contents, page info, page break, cross-band, and cross-band box. |
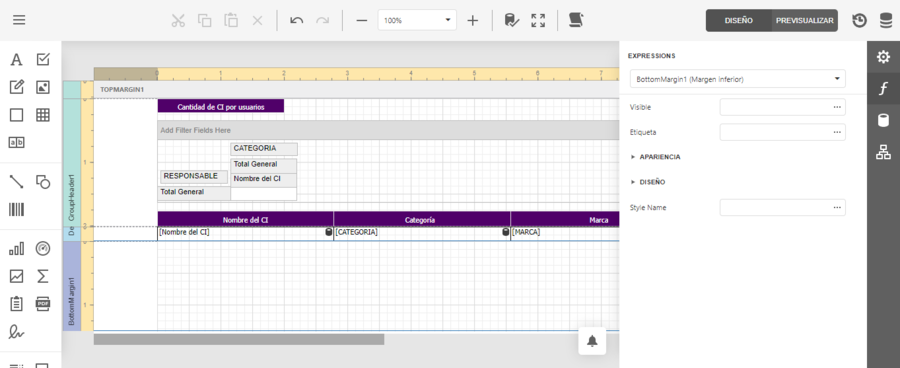
4. When you select a report control in the Designer Insights view, the information configured for the defined control is displayed, and a toolbar is enabled to customize the report information. The standard toolbar for controls is composed of the following items:
Properties: This option allows you to customize properties of report controls such as layout, dimensions, styles, editing options, font, padding, scripts, summary, size, text.

Expressions: This option allows you to configure the design and style elements of the report through an expression editor.
List of Fields: This option allows you to define a query, add the information according to the source of the data, and include parameters in the report.
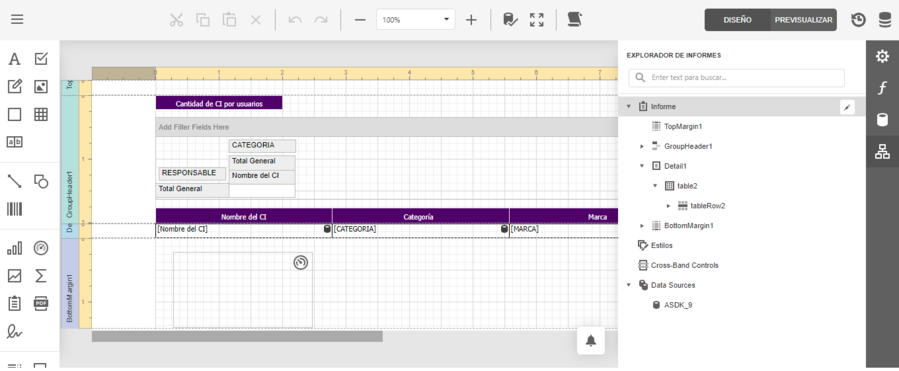
Report Explorer: This item allows you to know the structure and configuration of the report.
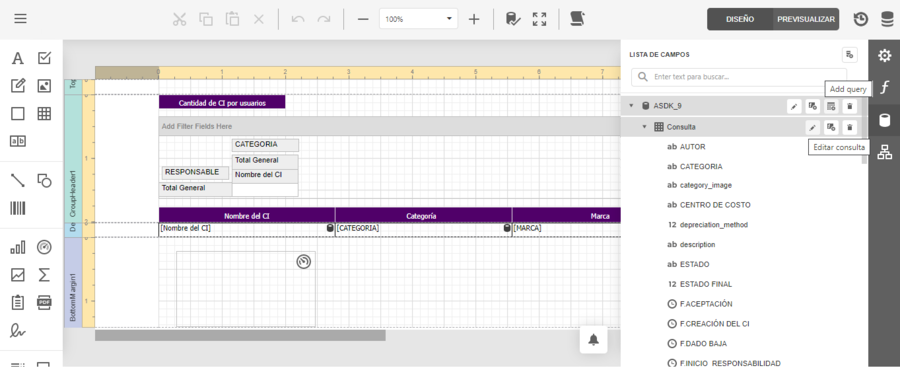
List of Fields
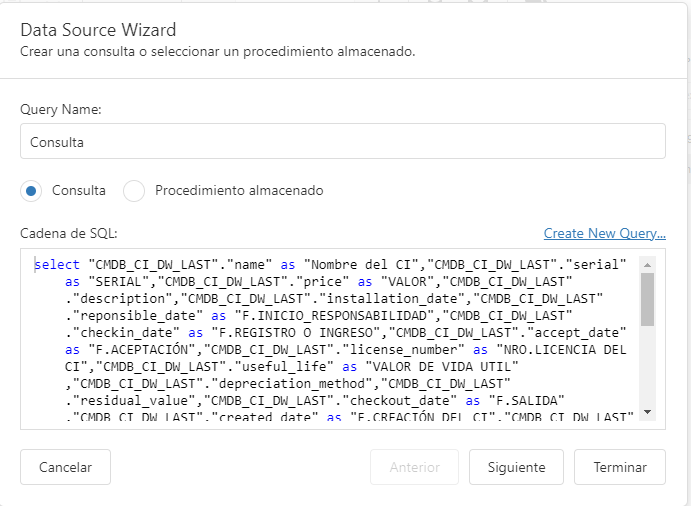
When you select the data source or a query from the Field List category, you will have access icons available to add a query (Add Query) or edit a query. The Data Source Wizard window is enabled to create a new data query or stored procedure.
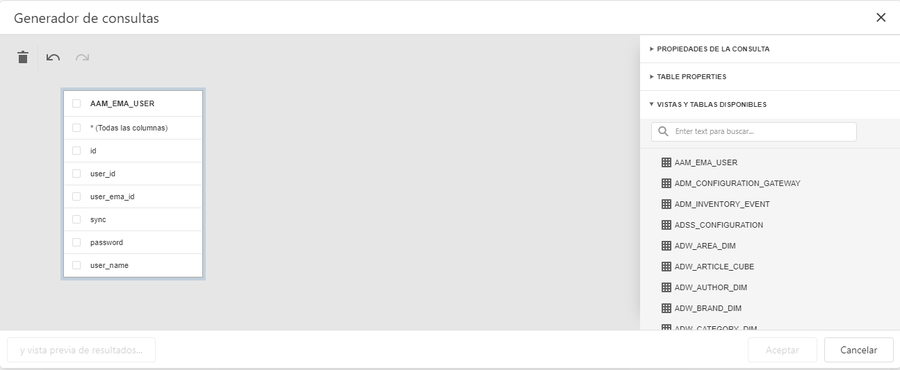
From the data Source Wizard you can select the options Run Query Builder or Create New Query, to access the query builder and graphically model the queries included in the dashboard and report editor. View Query Builder
5. In the report designer header, you can find a toolbar to customize the layout size and automatically preview reports, set timeout, or set pagination options.
Report Menu
6. In the main menu of the report designer, you can access the menu, where you can access the following options:
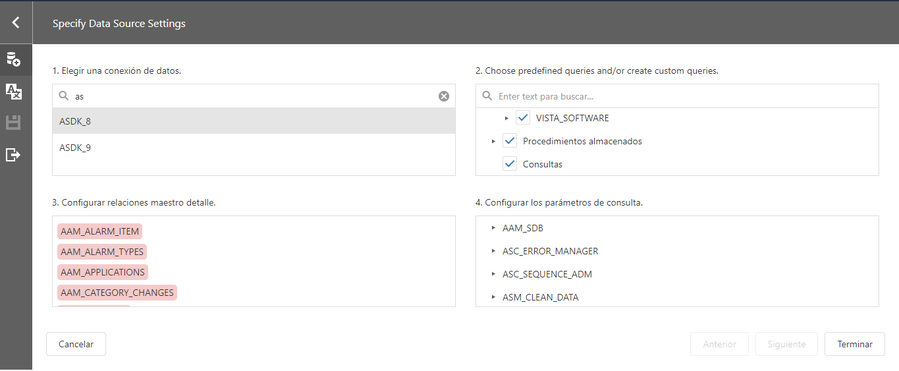
Add Data Sources: This option allows you to query or aggregate the information according to the source of the data. When selecting a record from the data source, choose a predefined query, define the master detail relationships, and define the query parameters.
⚐ Note: If you want to create a query with different data sources then take a look at Federated consultations.
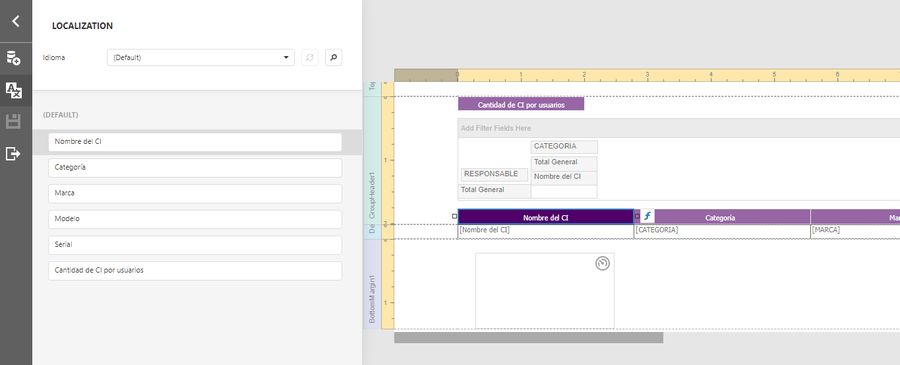
Localization This option allows you to customize the language of the report presentation.
Save: This option allows you to save the reporting presentation.
Reporting TimeOut
Allows you to configure the timeout for the execution of queries in the Data Sources of the reports.
The type of data source you are working with must be taken into account.
| Data Source Type | Description |
|---|---|
| Production | It is the original data source intended for creating, updating and reading information. |
| Replica | Copy of original data source used for reading large amounts of information. |
Timeout in Production Data Sources
For production data sources, the timeout value is 30 seconds for all reports.
To set the timeout to a value other than 30 seconds, contact your system administrator
⚐ Note:
- The defined timeout applies to all data sources in the reports.
- 30 seconds is considered to be an efficient value so as not to overwhelm resource utilization in production data sources.
Timeout in Replica Data Sources
In replication-type data sources, the timeout is applied individually for each report and can be greater than 30 seconds, with no time limit.
To perform this configuration, consider the following steps:
1. Enter the report designer.
2. On the main toolbar, click the Timeout icon ![]() to configure the timeout.
to configure the timeout.
3. The window is enabled Waiting time where you can enter the value in seconds for the report query.
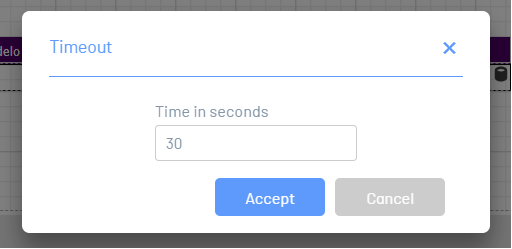
4. Click Accept to save your changes. You don’t need to save the report layout.
⚐ Note:
- When you save the Timeout, the changes are not reflected in the designer, because they are saved within the report.