
This editor allows you to customize and configure the information of your own indicators according to the business, making use of different controls and filters to organize and present the information graphically
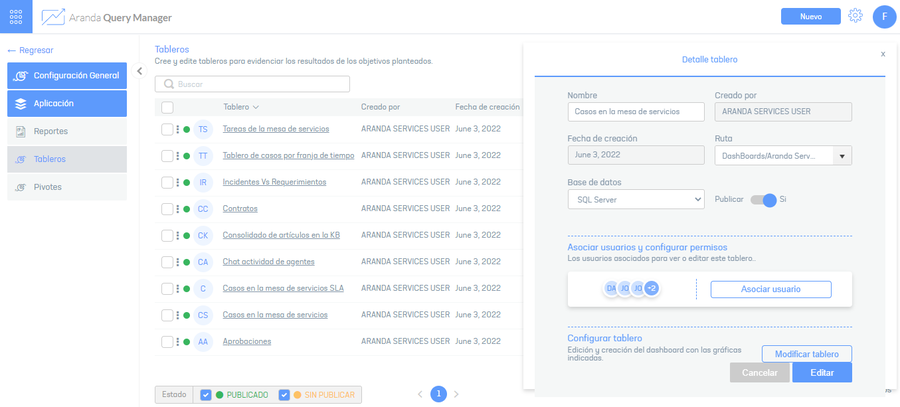
1. To access the dashboard designer, go to the AQM configuration console, in the Application from the main menu, select a record from the list of existing boards, and in the detail view click the Modify Dashboard.
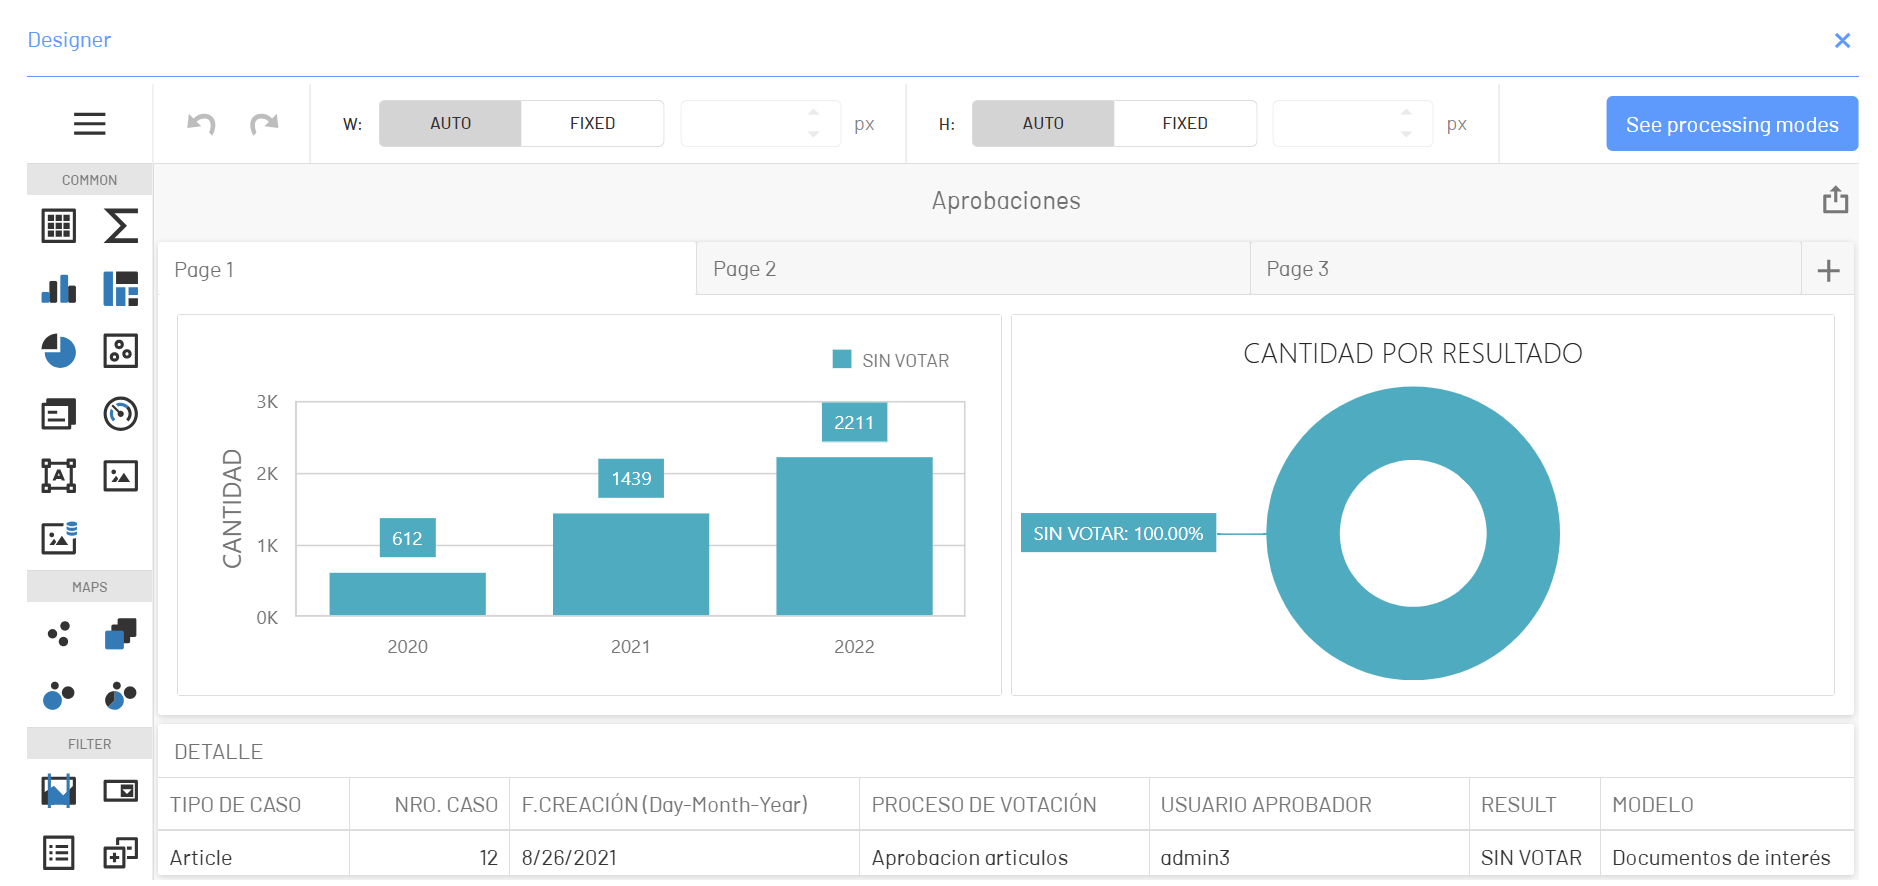
2. The dashboard designer is enabled where you can customize the information generated. In the main menu of the designer you can see different dashboard controls to organize the information on the board and in the dashboard view you can use the different controls. Each dashboard is made up of graphical regions called item dashboards, to which you can include the various controls.
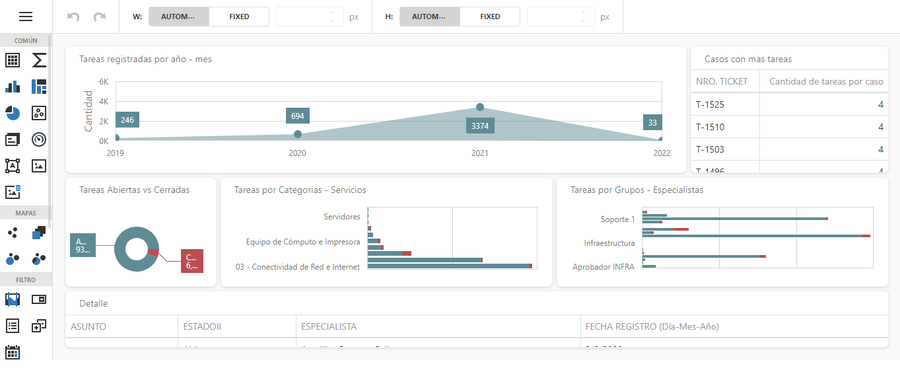
3. To design a board, select the control of your choice from the main menu and move it to the designer’s board view.
Controls
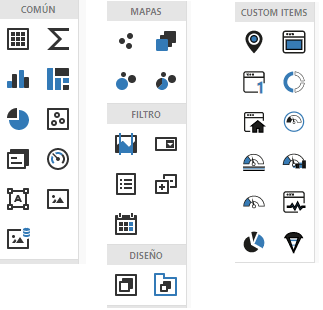
The dashboard controls are grouped into categories that allow you to design and customize the dashboard with different characteristics
| Control Type | Description |
|---|---|
| Common | This category groups the information display controls as: Tab-Cube-Graph, TreeMap, Pies, Scatter Charts, Tabs, Gauge, Text Box, and Bound Image. |
| Maps | This category groups the controls that present the information using georeferencing elements such as maps: Geo Point Map, Choropeth Map, Bubble Map, Cake Map. |
| Filter | This category groups controls to filter information, such as: Range filter, combo box, list box, tree view, and data filter. |
| Design | This category is made up of the group and tab container controls |
| Customized | This category groups custom controls such as: Online map, webpage, kpi number, donut, kpi icon, circular gauge, linear gauge, bar gauge, just gauge, kpi icon bar, extreme chart, funnel chart |
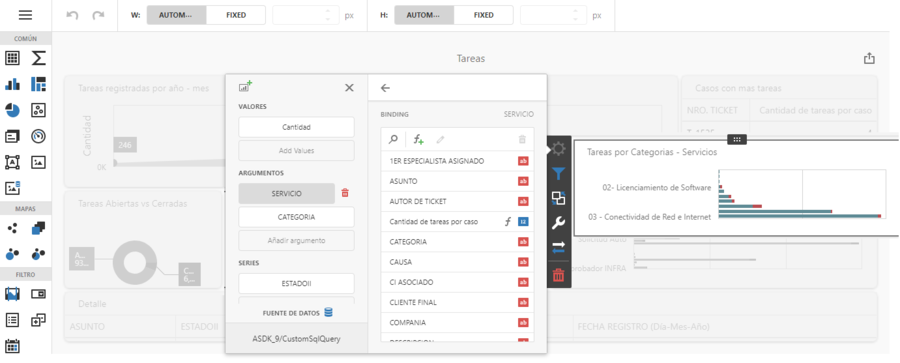
4. When you select a dashboard or dashboard item, the information configured for the defined control is displayed and a toolbar is enabled to customize the dashboard settings. The standard toolbar of the controls is composed of the following items:
Links: This option allows you to relate relevant information or values from each control. Example you can modify values of the indicator, define an argument with the existing variables, configure series, define dimensions and measures of the dashboard, display the data source.
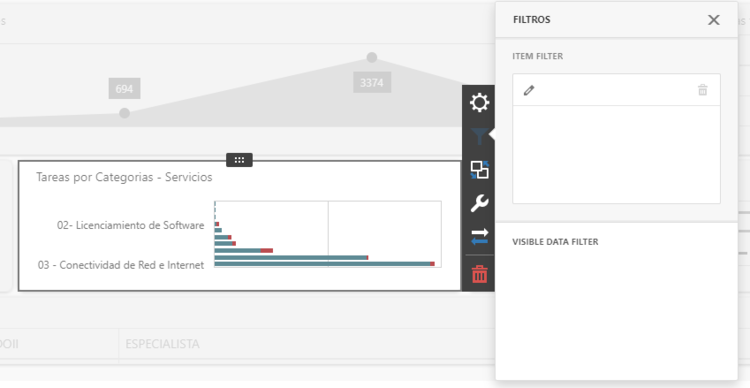
Filters: This option presents the filters for each control.
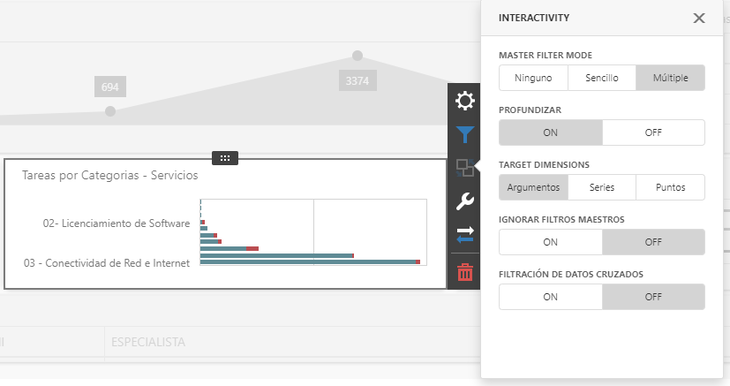
Interactivity: This option presents interactive options for each control with items such as master mode, target dimensions, ignore master filters, or cross-data filtering.
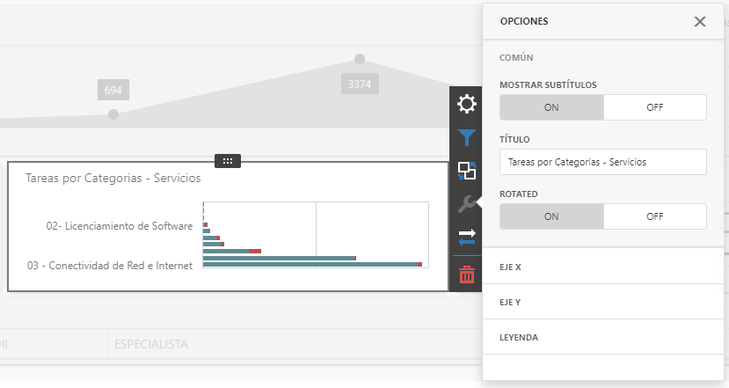
Options: This item allows you to define the styles and presentation of the board by including elements such as presentation of titles, layout and labels of the chart, diagram of colr.
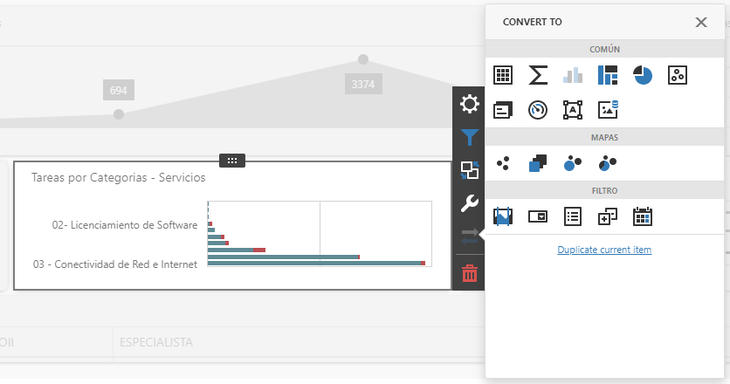
Convert to: This option allows you to convert the assigned control to the selected dashboard, using the available controls.
Remove: This option allows you to delete the selected board.
5. In the information view of the Dashboard Designer, you will have the option to export each board to PDF, Image, or Excel format, using the corresponding icon.
6. In the dashboard designer header, you can customize the layout size of the dashboards automatically or by correcting the pixel size of the layout.
Dashboard Menu
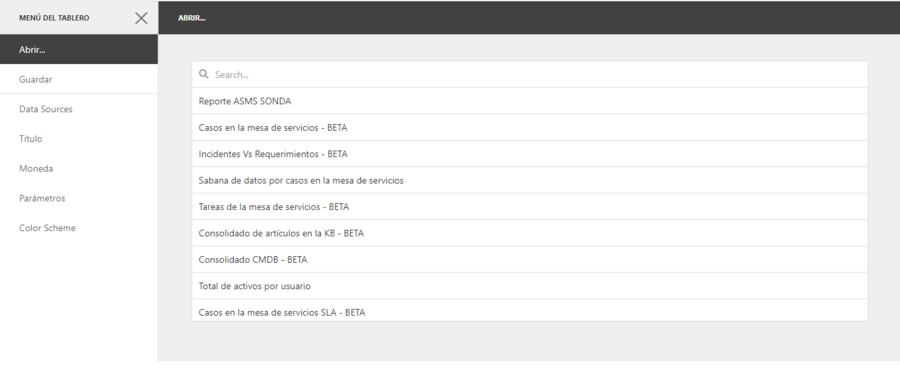
7. In the main designer menu you can access the dashboard menu, where you can access the following options:
Open: This option presents a list of the dashboards generated in AQM. Selecting a created record enables the display of the dashboards.
Save: This option allows you to save the presentation of boards.
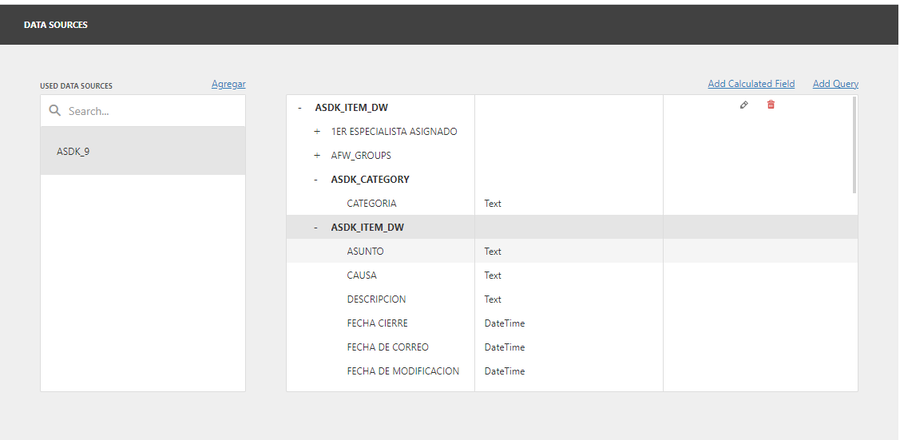
Data Sources: This option presents the context information view of the database. View Data Source
Title: Here you can define the characteristics of the selected board title.
Coin: This option sets the culture and currency in which the boards are presented in the designer.
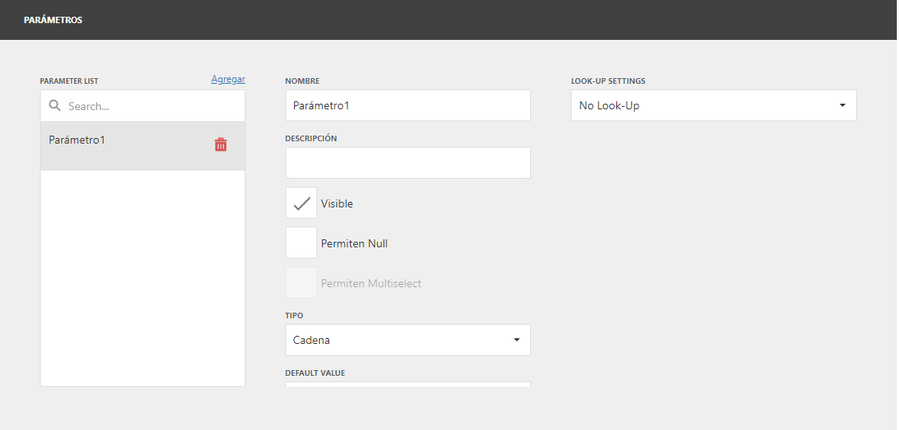
Parameters: The context parameters of the database are defined.
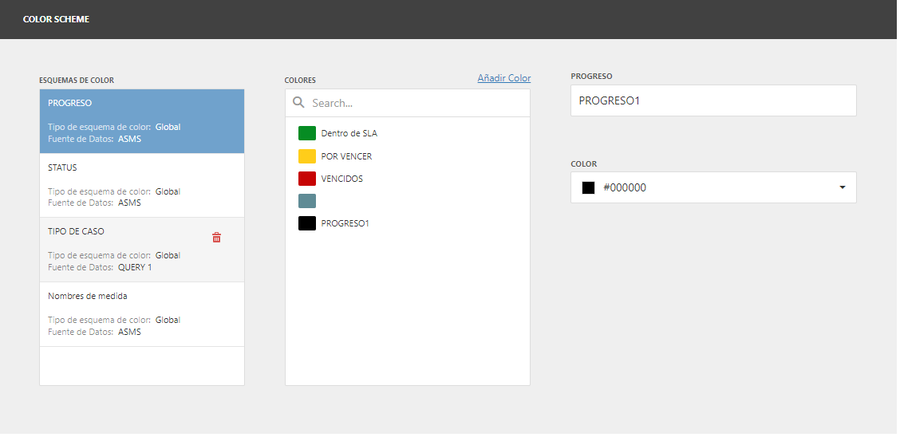
Color Scheme: Set the colors to be set in the dashboard visuals such as progress, status, case types, and measure name.
Data Source
By accessing the Data Sources, you will be able to consult or add the information according to the origin of the data.
1. In the main menu of the dashboard designer, enter the dashboard menu and the Data Sources.
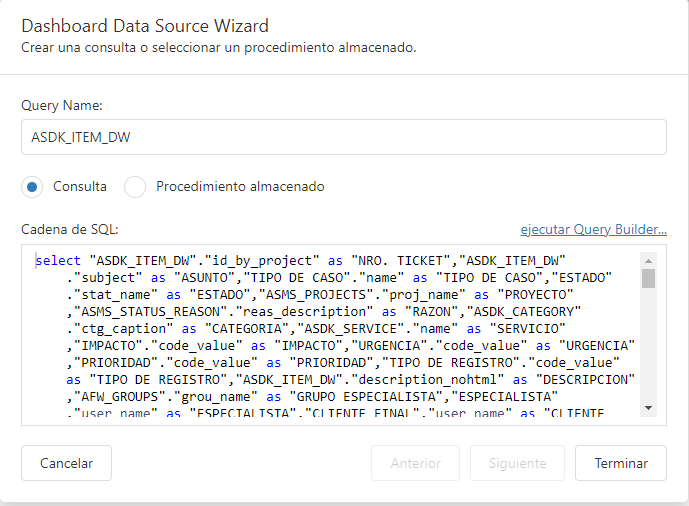
2. Select a record from the data source and select the edit icon, the window is enabled Data Source Wizard Dashboard, to view the query and modify the required information.
3. To create a new data query or stored procedure, from the Data Source window, select the Add Query; window is enabled Data Source Wizard Dashboard and complete the required information.
Run Query Builder
4. Select the option Run Query Builder, to access the query builder, to graphically model the queries included in the dashboard and report editor.
⚐ Note: If you want to create a query with different data sources then take a look at Federated consultations.
Board processing modes
Allows dashboard queries to run by leveraging client or server resources.
⚐ Notes:
- If you have more than one query, you can configure the processing mode for each query.
- Configuration can only be done the first time a dashboard is edited.
- Stored procedures don’t work in data sources with processing mode Customer
1. In the main menu of the dashboard designer, click the View Processing Modes to display the screen with the list of data sources associated with the dashboard.
2. Select the processing mode for each of the data sources.
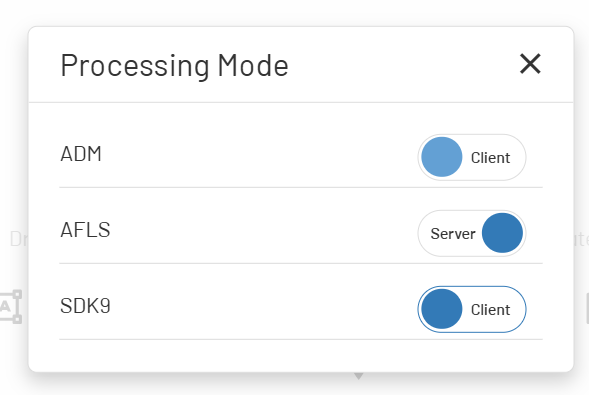
3. Close the window.
4. In the main menu of the dashboard designer, go to the dashboard menu and click Save to confirm the changes.
Limitations
⚐ Limitations:
- Stored procedures are not supported in processing mode Server.