
Conditions for using monitoring in ADM
1. Preserve on LAN network
- You must have a store in the LAN Network, since monitoring can only be carried out on computers accessible from this network.
2. User credentials
- The user used for the authentication and execution of the computer monitoring must follow the format “Domain\User”. This format is required so that ADM can successfully authenticate to the Active Directory domain and obtain the necessary permissions for computer monitoring.
3. Enable WMI and RPC
The Windows Management Instrumentation (WMI) service and the Remote Procedure Call (RPC) service must be enabled and working properly on the computers to be monitored. ADM uses WMI and RPC to collect information from the machine’s processor, memory, and disk through commands to computers. Communication is done via port 135 TCP/UDP (RPC Endpoint Mapper) and a range of dynamic ports assigned by RPC. Please note the following validations:
- Verify that the WMI service is running on the monitored computers.
- Make sure that your Windows firewall (or any other firewall) allows WMI and RPC traffic. Specifically, connections over TCP/UDP port 135 and the RPC-assigned dynamic port range (typically above 1024) must be allowed.
⚐ How to find dynamic port range in Windows: Configure on a Windows system using the following command on the command line (run as administrator):
netsh int ipv4 show dynamicport tcp
netsh int ipv6 show dynamicport tcp
Esto mostrará el rango de puertos dinámicos que RPC está utilizando. Es importante tener en cuenta este rango al configurar el firewall.
Recomendaciones adicionales:
-Simplificar la configuración del firewall (si es posible): En lugar de abrir un rango amplio de puertos dinámicos, considera la posibilidad de restringir el rango de puertos dinámicos que RPC utiliza. Esto puede mejorar la seguridad y facilitar la administración del firewall.
-Usar la directiva de grupo (en un dominio): En un entorno de dominio, utilizar la directiva de grupo para configurar los ajustes del firewall y los permisos de WMI de forma centralizada.
- I configured, if required, WMI permissions to allow the user used for monitoring to access the information.
View Monitor
1. In the Inventory Device Detail View, select the Monitoring, to see real-time information about a device’s disk, memory, and processor usage percentage.
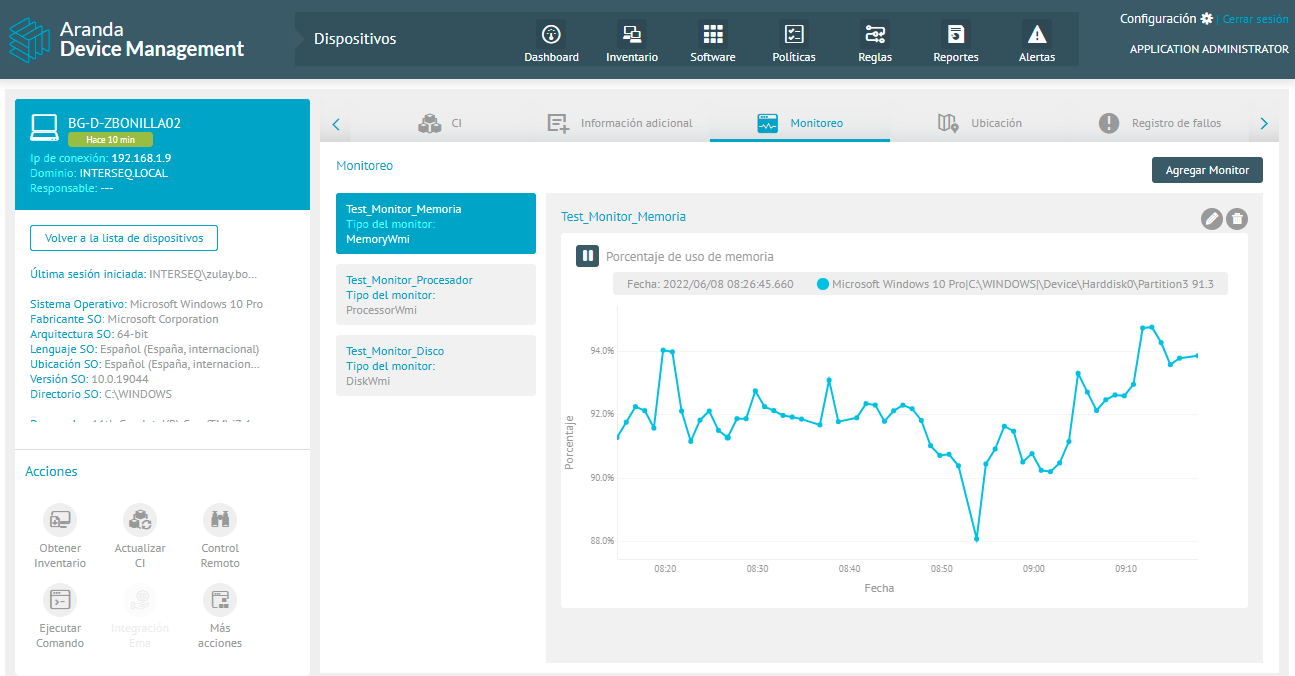
⚐ Note: The monitoring feature is not currently supported by Windows 7 OS.
Creating a Monitor
You can create different types of Windows-like monitoring to load important information on each of the monitors you want to include in your application, like this:
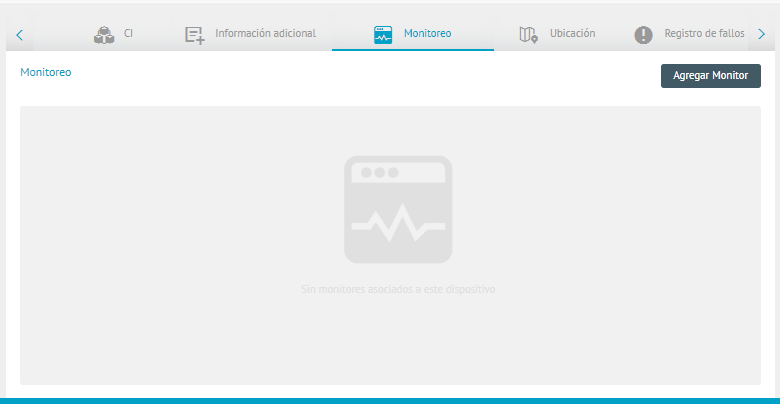
2. To create a monitor, in the Inventory Device Detail View, select the Monitoring and click the Add Monitor.
3. In the window Add New Monitor enter the Monitor Name and Monitor Type fields. Turn on the mode to perform monitoring; by device name or IP address. Select the polling interval, timeout time, and metrics you want to display.
4. Select or add credentials and click Save.
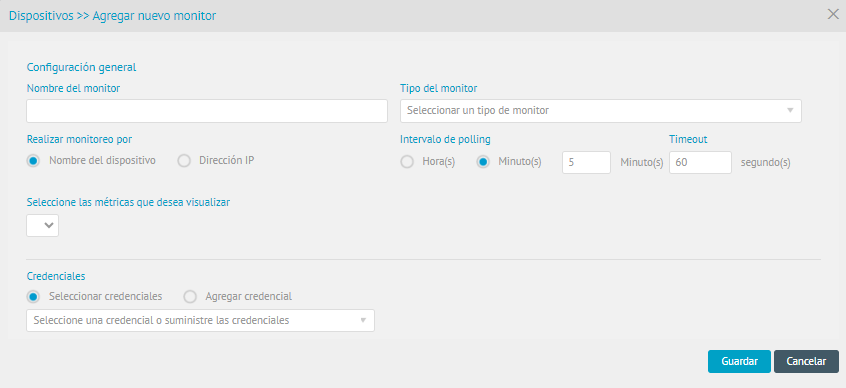
⚐ Note: When credentials are entered for a user belonging to a device that is not in the domain, the following must be added:* *.* *and then the user’s name, e.g.: .\Administrator.
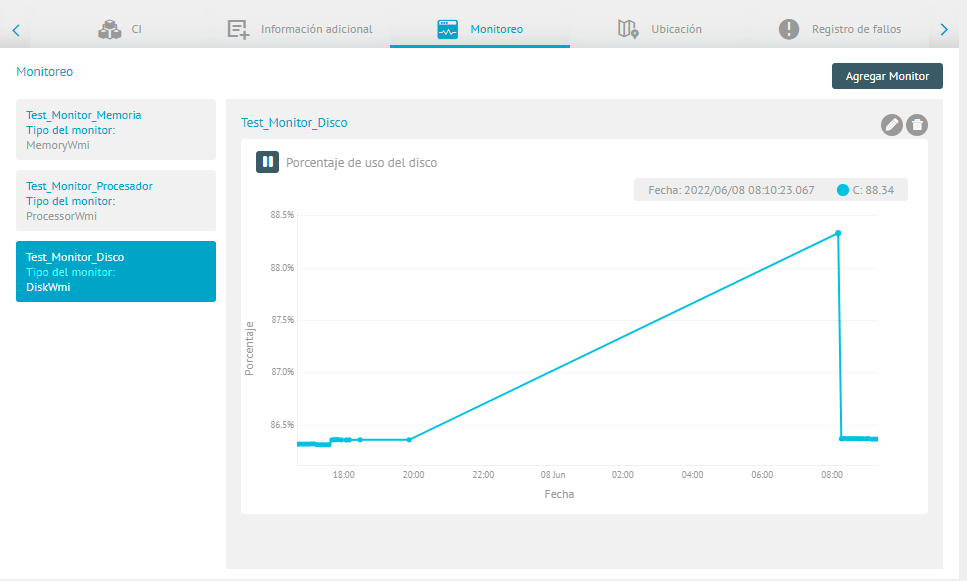
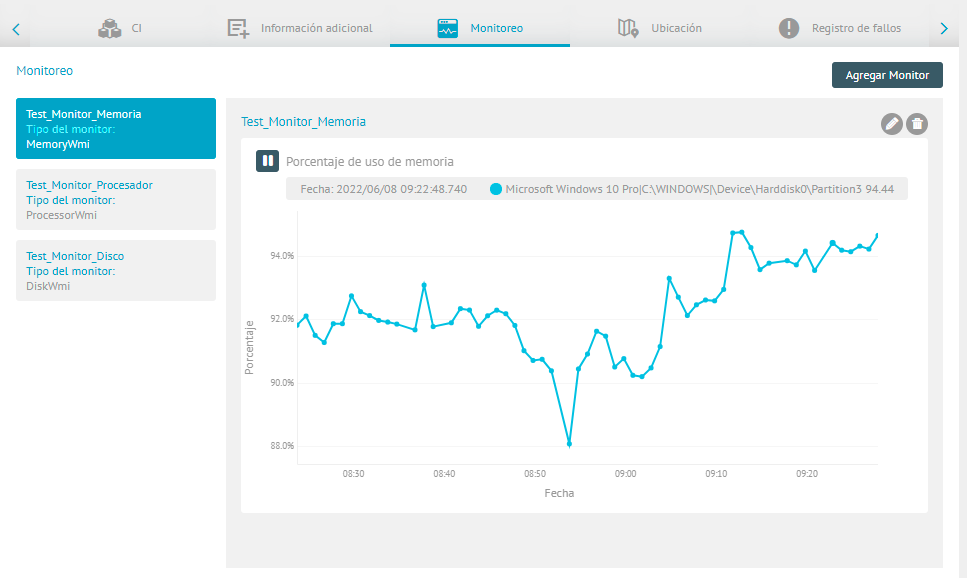
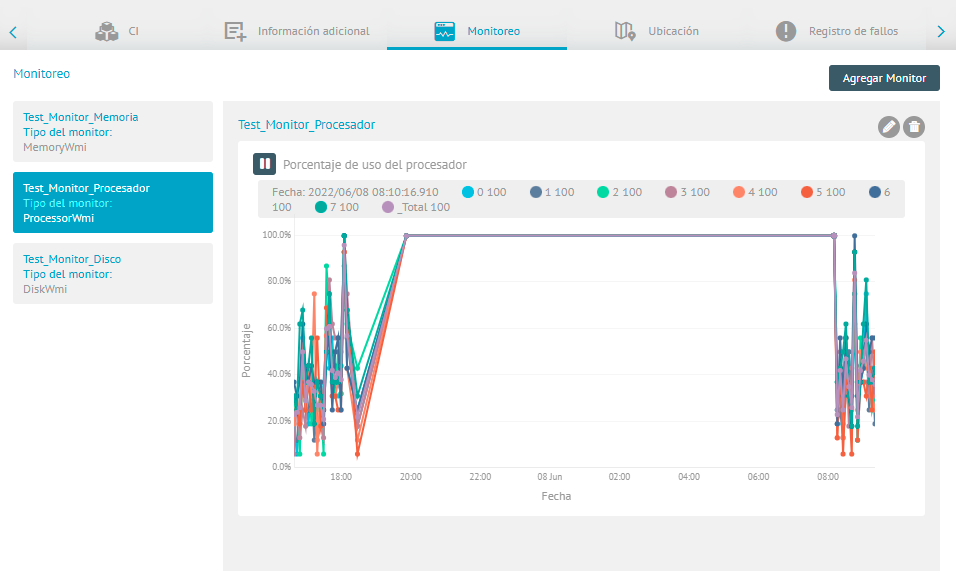
5. After collecting the information from the metrics, it will be graphically represented as follows (depending on the activity of the monitored machine):
Example1: Percentage of disk usage.
Example2 Percentage of memory usage.
Example3: Percentage of processor usage.
⚐ Note:
- It is only possible to create one monitor according to its type.
- The information displayed pertains to the last hour of activity
Monitor Actions
6. The activity of the created monitor will have the following management actions:
| Action Monitor | Description |
|---|---|
 |
With this action you will be able to Pause the graphical representation of information from the monitor. |
 |
With this action you will be able to Resume the graphical representation of information from the monitor, updating the information from the moment it was paused. |
⚐ Note:
The pause option aims to stop the graph visually but not to prevent the collection of information. When you make the tab change, the graph will return to its original state, showing all the information collected (including the information during the pause time).
Edit Monitor
7. In the Inventory Device Detail View, select the Monitoringicon, select a monitor, and in the workspace click the Edit. 
8. Modify the required information and click Save. You will be able to display a message confirming the correct change.
Remove Monitor
9. In the Inventory Device Detail View, select the Monitoringicon, select a monitor, and in the workspace click the Eliminate.  You will be able to display a message confirming the action executed.