
Settings for Displaying Software Usage
1. Enable the Licensing - Software Metering during agent profile setup. The activity reflected in the use of software depends on the information parameterized in this step.
2. Set the time when the information will be saved Measurement on workstations to set the display interval to the measurement of your devices and configure how often you want to clear the history.
Viewing and customizing Software usage
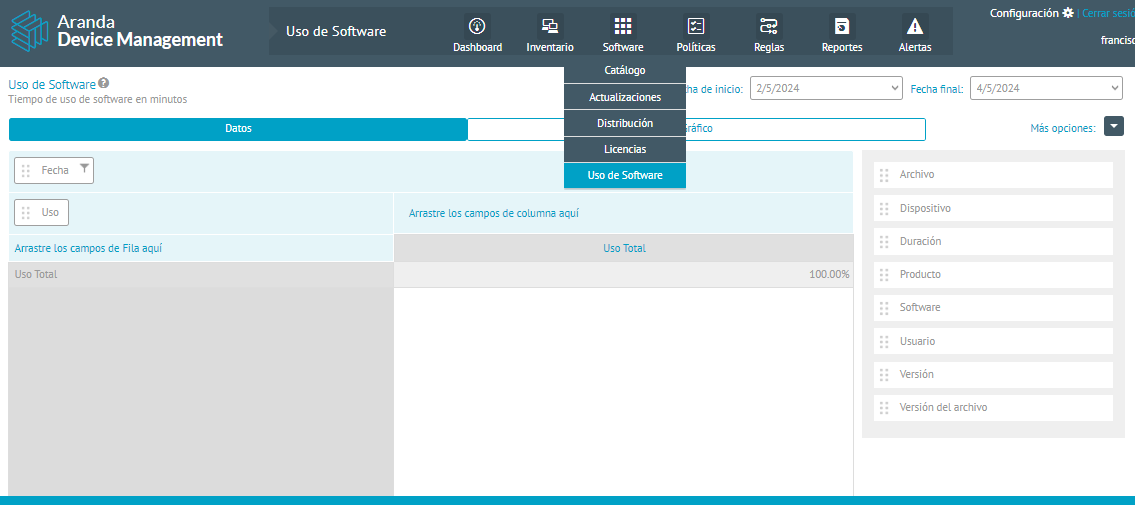
3. To control the proper use of assigned licenses, go to the Home view of the ADM Management Console, in the Software from the Header menu, select the Use of Software.
⚐ Note: You can also access the use of licenses, in the detail of the devices of the inventory module, in the option Use of Software
4. To determine software usage, select a date range and drag the available fields (product, duration, user, and others) over one of the blue segments in the workspace and the Data
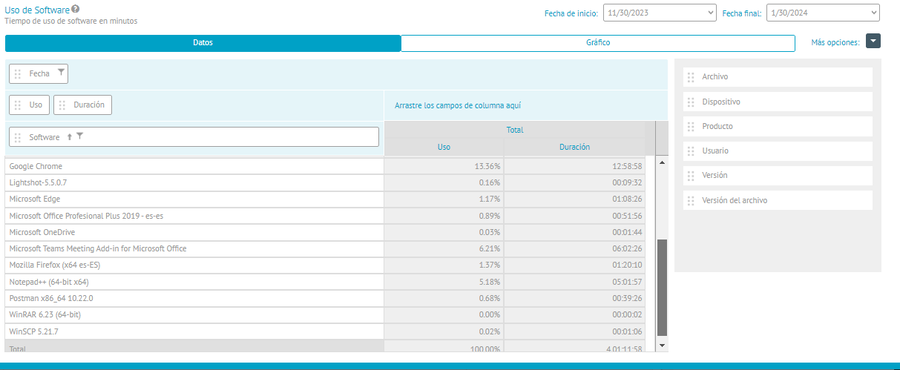
The fields available to filter the information to determine the use of the software are:
| Field | Description |
|---|---|
| Start Date | Initial date on which you want to see the use of the software |
| End date | End date on which you want to see the use of the software |
| Duration | Total time per day used the program |
| Product | Name of the product used on the device |
| Software | Name of the software used on the device |
| User | ADM user performing software usage inventory (ASM) |
| Version | Software version |
| File Version | File Version |
⚐ Note: You can improve the software usage information filter by implementing a blacklist of apps that should be excluded from tracking or by whitelisting only the apps that you should monitor. Finally, you have the option to detect downtime on a resource.
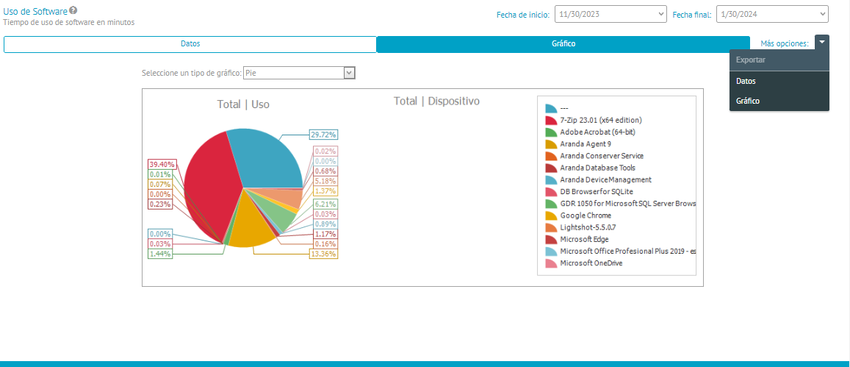
5. In the Software Usage View, on the Graphic you will be able to visualize a graph with the filtered data and you will be able to define the type of graph to be used (Pie, Pie 3D, Doughnut, Doughnut 3D).
6. In the Software Usage View, select More options to export the data information in Excel format (xls) and the graph in image format (.png).
⚐ Note: The processing of this inventory is generated at midnight and can be visualized in the device details during inventory management.