
In the Planning of the Monitoring, the monitor can use the search engine to select several specialists in the field and observe, through a Gantt chart, how the orders are distributed in a day, a week or a month. This information is particularly useful for finding idle times by specialists.
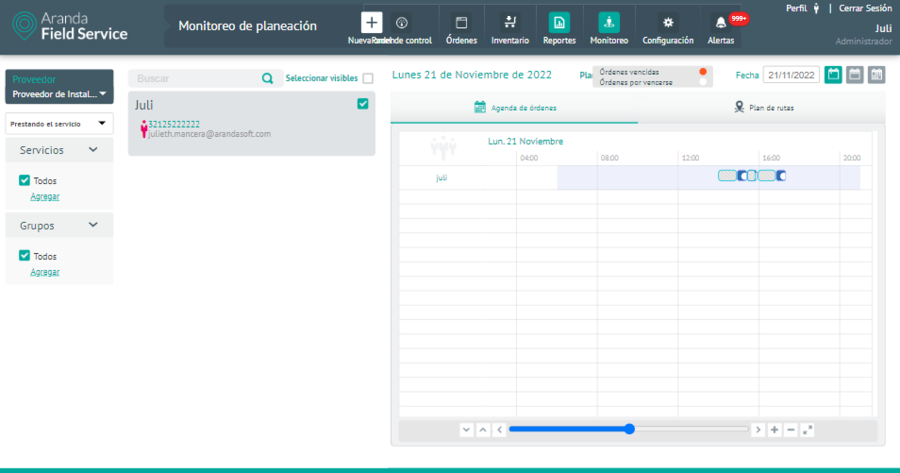
Filtering and sorting the planning query
You can filter the query information under the following criteria:
- Supplier: The monitor will only be able to view the vendors assigned to it, so you can filter the specialists only according to those vendors from the selector.
-
Specialist availability: Filters specialists based on one of these conditions:
- That they are providing any of the configured services, that they have work orders assigned.
- That they are trained and have the skills to attend to any of the configured services, that they are available and have the capacity to attend the service.
- Services: Filters specialists based on the service they are providing or trained for and who have that or more services set up as a query criterion. The service filter depends on the configuration defined in the previous specialist availability combo.
- Groups. Filter the specialists according to the group they are associated with.
When you select one of the specialists thrown by the query, in the right panel you will see the information of the orders, presented in two tabs: Order Schedule and Route Plan.
Order Schedule
In this tab, you will be able to see the load that has been assigned to each of the selected specialists. Each order contains information about when the specialist starts the trip and the scheduled time of execution and completion of the job. Spaces on the graph where there are no scheduled orders are considered time-outs.
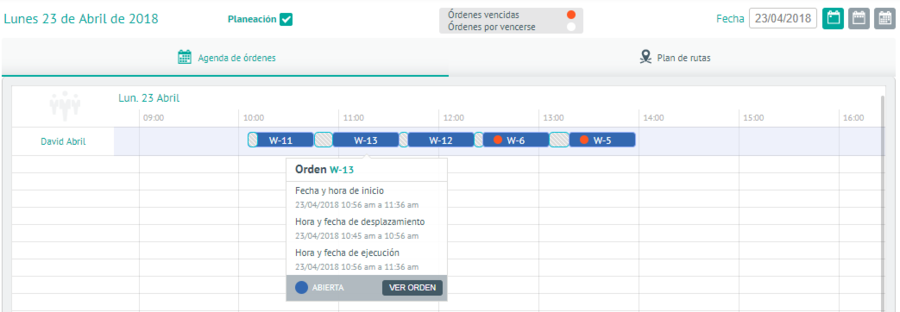
- The blanks represent the times in which the specialist can attend to work orders.
- The stripe pattern represents the scheduled times where the specialist must travel to the place of the next order.
- The color in each of the orders represents the state in which it is found.
Through the controls located in the upper right, the monitor can modify the dates on which the information is displayed. This data can be displayed on a daily, weekly, or monthly basis.
When you move the pointer over any order, you can see a summary of it and display the scroll times and the scheduled start time. Likewise, the “view order” button will open the detail.
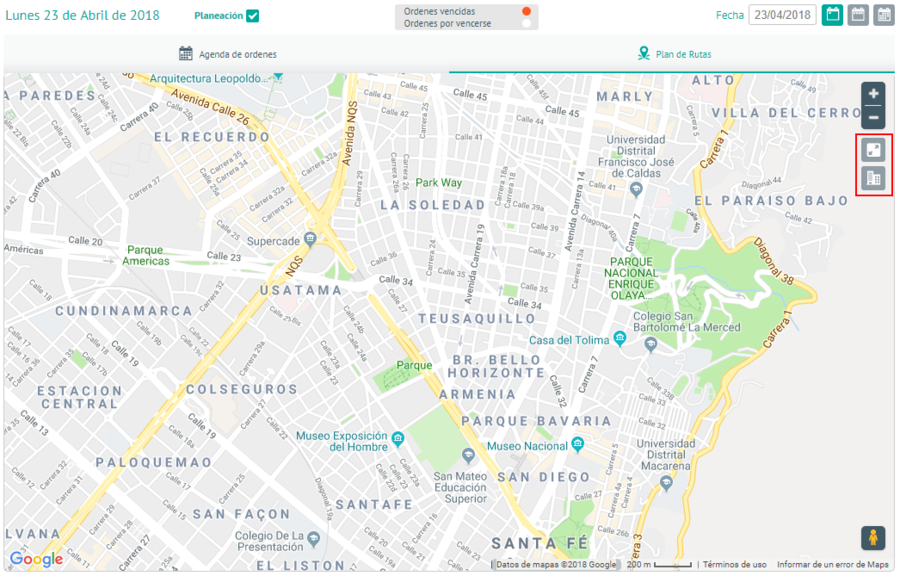
Route Plan
In this tab, the user will be able to view the map with the planned route for one or more specialists and the positions in which they will be according to the selected date range.
⚐ Note: The positions in which the specialist will find himself are the positions of the work orders assigned to him.
This map offers options to expand and show the location of the company.
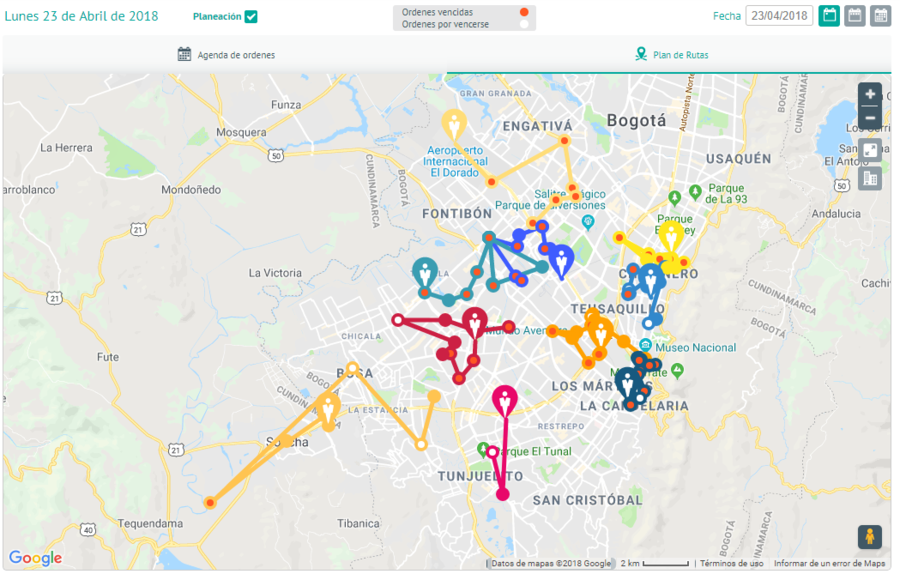
Route of different selected specialists
The map will display the routes of all the selected Specialists, each with a different color.
Route of different selected specialists
The controls located in the upper right corner allow you to modify the dates on which the information is displayed. This data can be displayed on a daily, weekly, or monthly basis.
If the selected specialists match in one or more locations, the user can click on the common point to separate them and see which users have positions in that point.
⚐ Note: The specialist’s location points will be displayed only if the specialist has orders assigned for the selected date range.
When you click on the specialist’s position, the system will present a pop-up description with some basic data such as the specialist’s name, the distance to the next point, and the remaining orders. The distance to the next point is shown in a linear fashion, this value may vary if the user selects the option to present the route with the Google option.
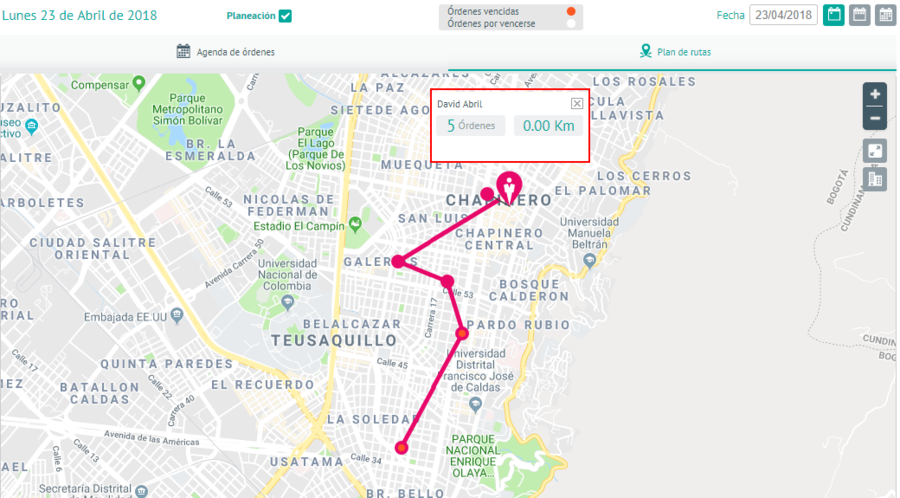
Route presented in a linear manner