View Reports
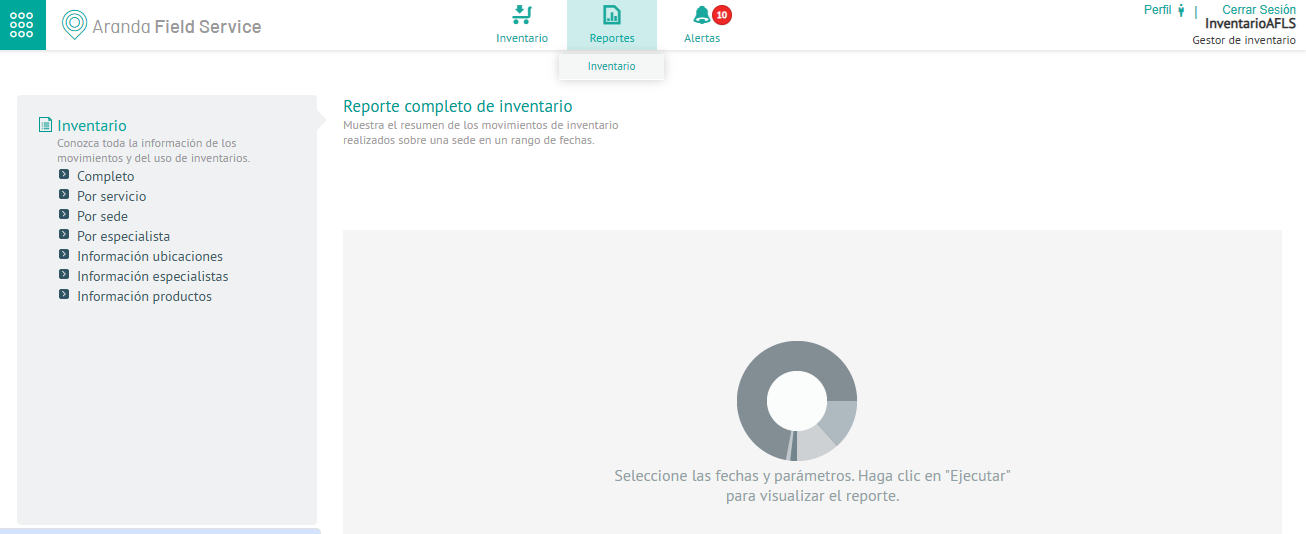
1. To view the reports with inventory information, with the Inventory Manager role enter the AFLS web console, in the Reports section of the main menu, select the option Inventory.
2. In the inventory filters on the main menu, enable the options required to generate the inventory report:
| Inventory Filter | Description | Preview Parameters |
|---|---|---|
| Complete | This report presents the user with a summary of the movements of inventory receipts, outputs and returns made within a range of dates, on one or all of the locations. | Start Date, End Date, Range, and Location. |
| By Service | This report presents the user with a summary of inventory utilization on orders for a specific service or all services, within a date range. | Start Date, End Date, Rank and Service. |
| By Venue | This report presents the user with a summary of inventory movements for one site or for all locations. | Location. |
| By Specialist | This report presents the user with a summary of inventory movements for one specialist or for all specialists. | Specialist. |
| Location Information | This report presents the user with detailed information about the locations registered in the application. | Not applicable. |
| Specialist Information | This report presents the user with a summary of inventory movements for one specialist or for all specialists. | Not applicable. |
| Product Information | This report presents the user with detailed information about the locations registered in the application. | Not applicable. |
⚐ Note: If the profile you logged in with is an inventory manager, you will be presented with the option to view all vendors.
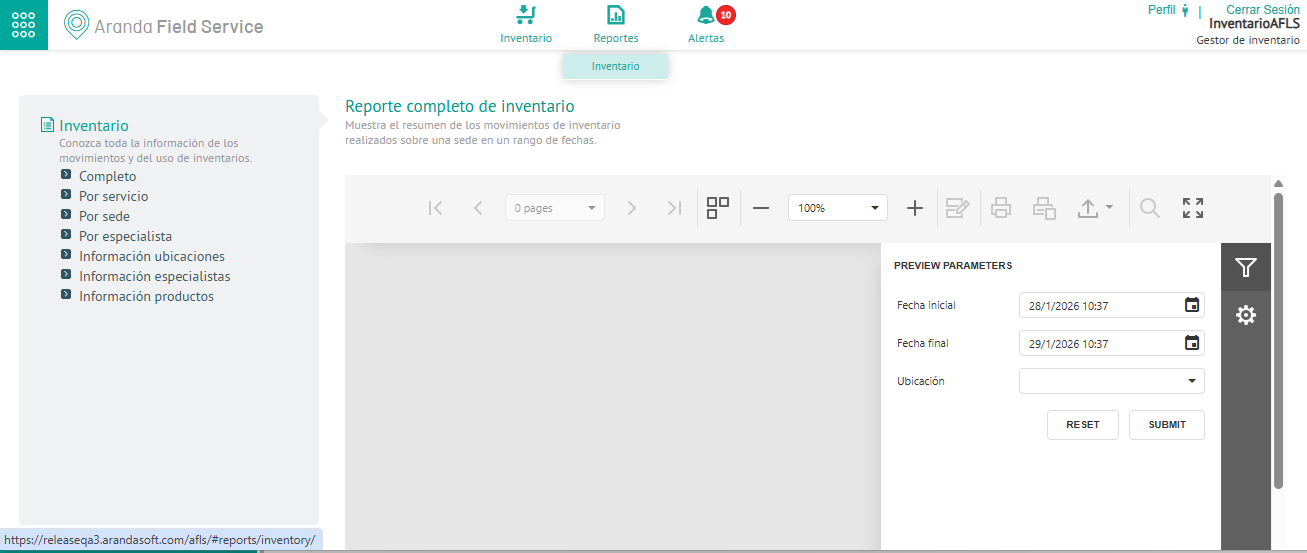
3. In the detail view of the activated report, in the side panel of the Report Designer Define the enabled preview parameters according to the filter enabled in the previous step. When finished, click on the SUBMIT to generate the report.
4. The generated report shows detailed information for each selected filter, as follows:
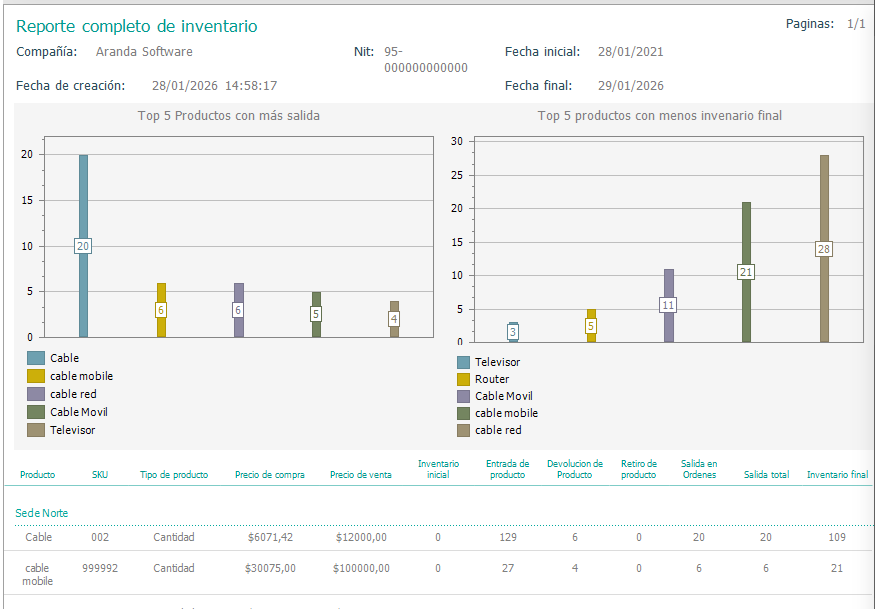
Full Report
The report shows two graphs: Top 5 products with the most sales and top 5 products with the least final inventory.
⚐ Note: If the location or in the selected date range does not have inventory, the system will display a message indicating that there is no data for the configured filter.
⚐ Note: If there are fewer than 5 products created, the system will display the number of products that are created. If there are more than 5, the system will present the 5 with the most output and the 5 with the least final inventory.
Report by Service
The report generates a graph indicating the 5 most used products.
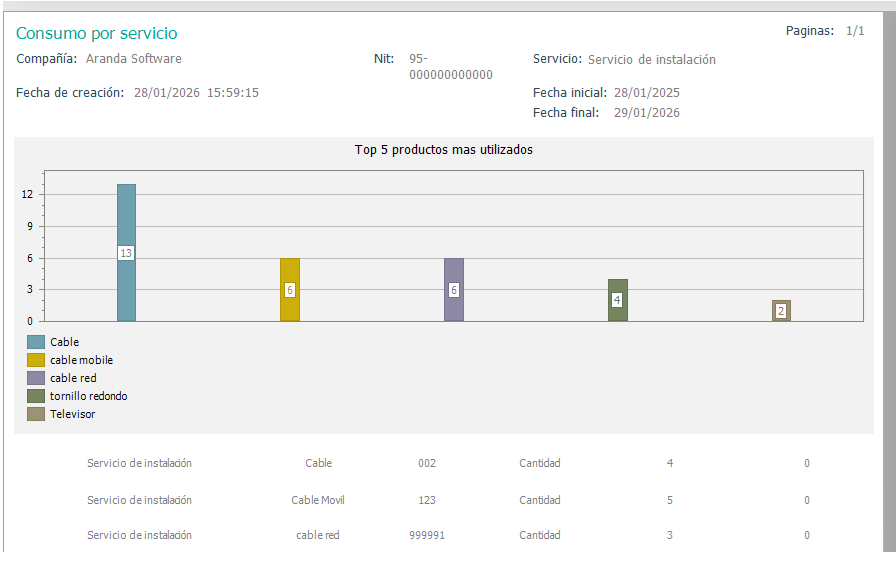
⚐ Note: If the service or within the selected date range does not have inventory, the system will present a message indicating that there is no data for the configured filter.
⚐ Note: If you have fewer than 5 products created, the system will display the number of products created. If there are more than 5, the system will present the 5 most used.
Report by site
The report generates two graphs: top 5 products with the least inventory and top 5 products with the most use in the last month.
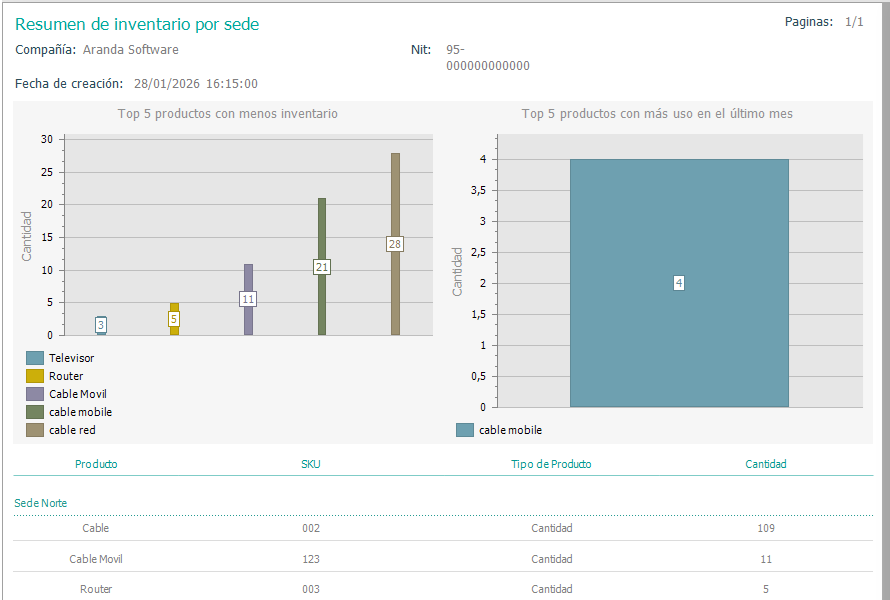
⚐ Note: If you have fewer than 5 products created, the system will display the number of products created. If there are more than 5, the system will present the 5 with the least inventory and the 5 most used.
Report by specialist
The report generates two graphs: top 5 products with the least inventory and top 5 products with the most use in the last month.
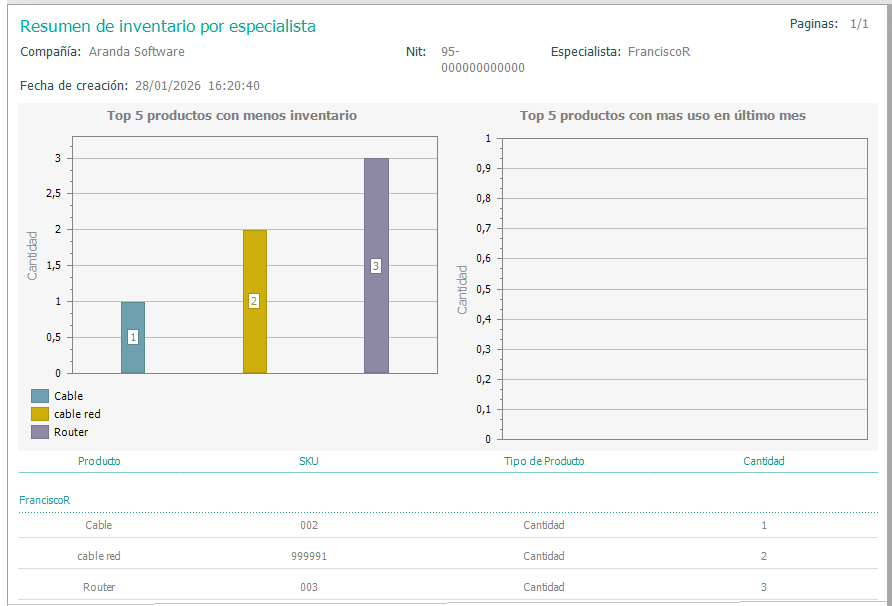
⚐ Note: If the specialist has less than 5 products, the system will present the number of registered products to the specialist. If there are more than 5, the system will present the 5 with the least inventory and the 5 most used.
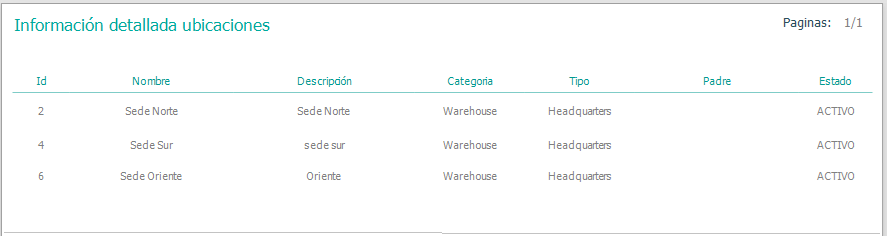
Location Information
The report generates information from the locations recorded in the application.
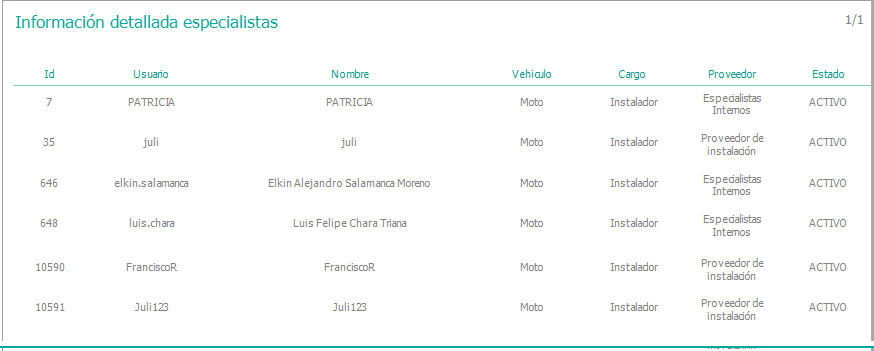
Specialist Information
The report generates detailed information on the specialists registered in the application.
Product Information
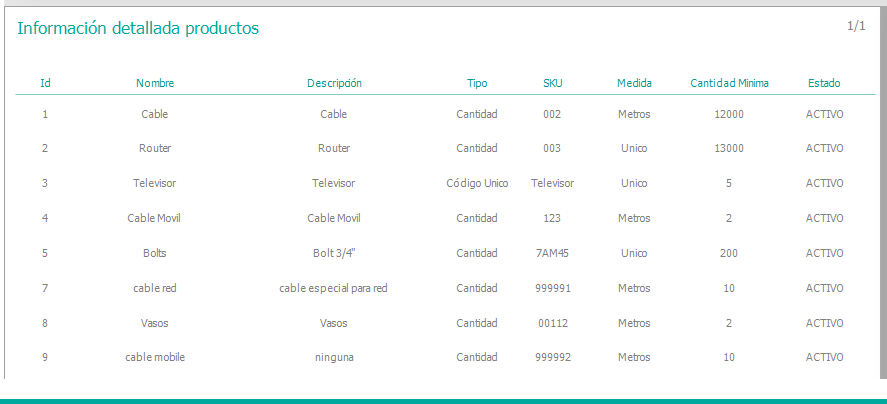
The report generates detailed information on the products registered in the application.