


View Reports
1. To view the basic reports that need to consult the behavior of work orders, with the Monitor Manager role enter the AFLS web console, in the Reports section of the header menu, select the option Orders.
2. In the order filters in the main menu, select a vendor and enable the options required to generate the order report:
⚐ Note: These reports have an associated order and therefore an associated provider. Monitors will only be able to see the reports of the suppliers they have associated.
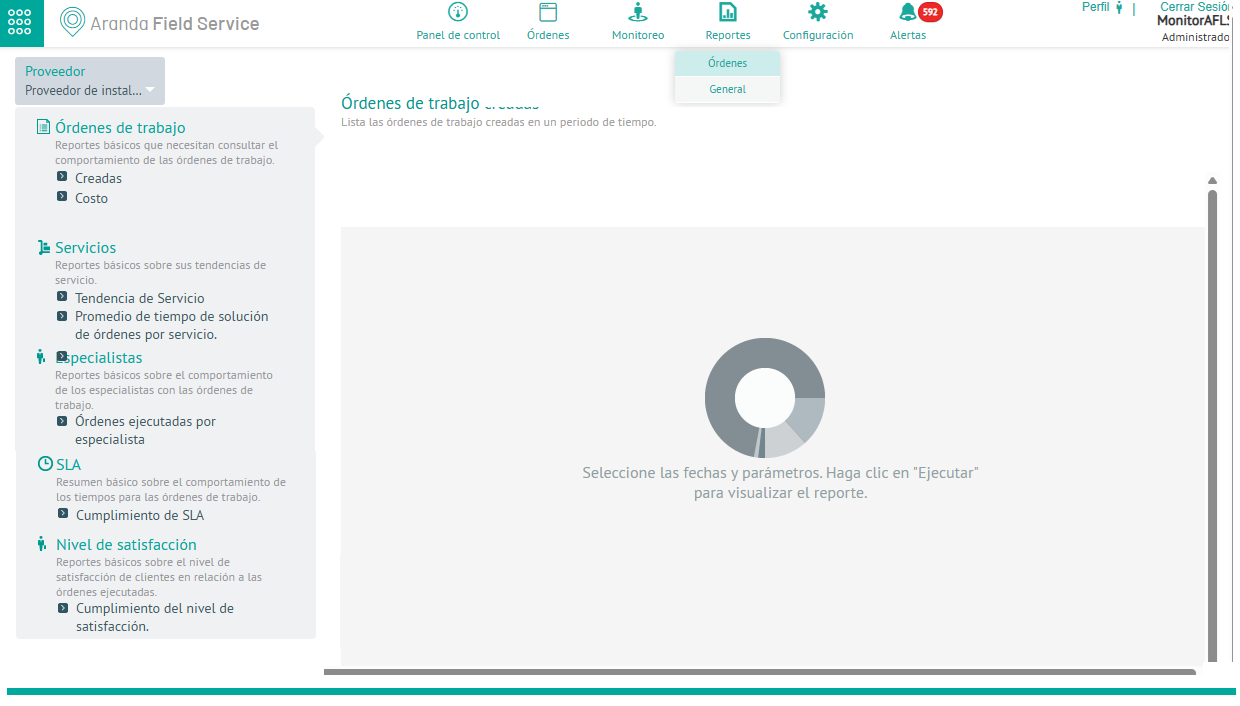
| Order Filter | Description | Preview Parameters |
|---|---|---|
| Work Orders/created | This report presents the user with a statistic of the work orders created in AFLS. | Start Date, End Date, Service Type, or All Services. |
| Work Orders/Costs | This report presents the user with statistics on the cost of executed work orders. | Start Date, End Date, Service Type or All Services, Company. |
| Services/Service Trend | This report presents the user with a summary of a service’s behavior in AFLS to validate compliance with the goals proposed for that service. | Term, Service, or All Services. |
| Services/Average Order Resolution Time by Service | This report indicates the speed at which work orders are resolved. It will help the monitor to know which services take longer and require more attention or more staff to provide a solution. | Start date, End date. |
| Services/Orders executed by specialist | This report indicates the performance of specialists in a range of time with respect to a particular service. Here it is possible to see which specialists have executed the most orders and the time it took them to execute them. | Start date, End date, Service. |
| SLA/SLA Compliance Report | This report indicates the number of cases per service that were resolved in a time range in AFLS. | Start date, End date, Service. |
| Satisfaction Level/Satisfaction Level Compliance | This report details the level of customer satisfaction according to a specific survey in a certain period of time. | Start date, End date, Survey. |
⚐ Note: If the profile you logged in with is monitor + dispatcher, you will be presented with the option to view all vendors.
3. In the detail view of the activated report, in the side panel of the Report Designer Define the enabled preview parameters according to the filter enabled in the previous step. When finished, click on the SUBMIT to generate the report.
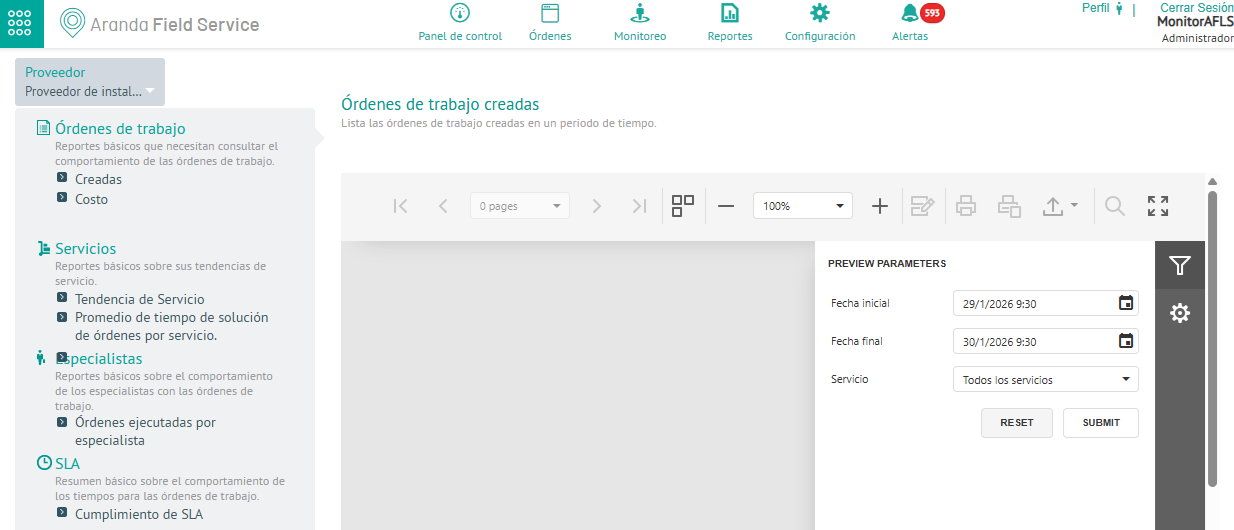
4. The generated report shows detailed information for each selected filter, as follows:
Report Created Orders
The report generates a grid with the most relevant data of the created orders that coincide with the selected services and dates.
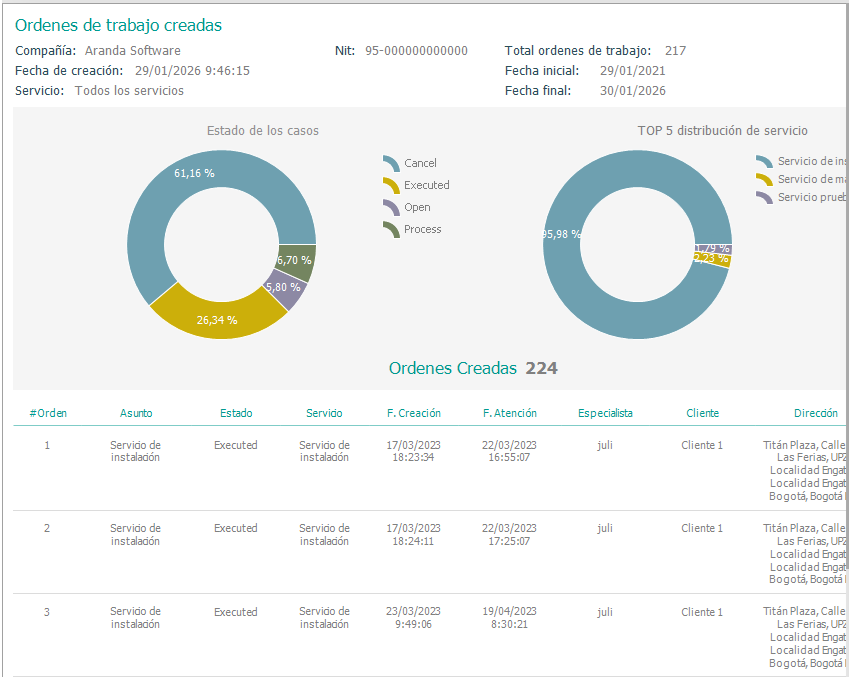
⚐ Note: If there are no orders created with the service or in the selected date range, the system will display a message indicating that there is no data for the configured filter.
Cost reporting
The report shows three sections: Cost Executed, Average Cost Executed, and Data Grid.
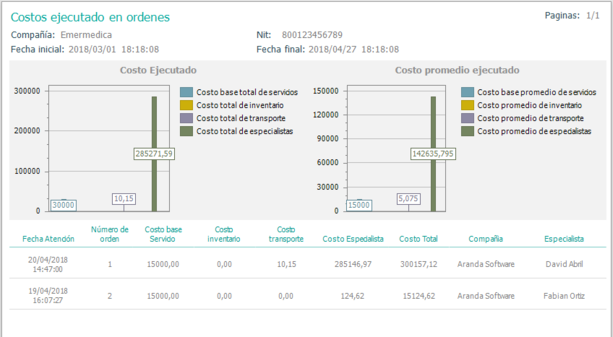
⚐ Note: If the service has no orders executed within the date range that the user selected, the system will present a message indicating that there is no data for the configured filter.
| Indicator | Description |
|---|---|
| Executed Cost | This graph indicates the cost of the following four parameters: Total Base Cost of Services, Total Inventory Cost, Total Transportation Cost, and Total Cost of Specialists. |
| Average Executed Cost | This graph indicates the average cost of the following four parameters: Total Base Cost of Services, Total Inventory Cost, Total Transportation Cost, and Total Cost of Specialists. |
⚐ Note: The value of the costs will depend on the cost configuration that has been given to the services and specialists; If the service or specialist does not have values configured, the result will not be visible in the graph, i.e. it will be 0.
Service Trend Report
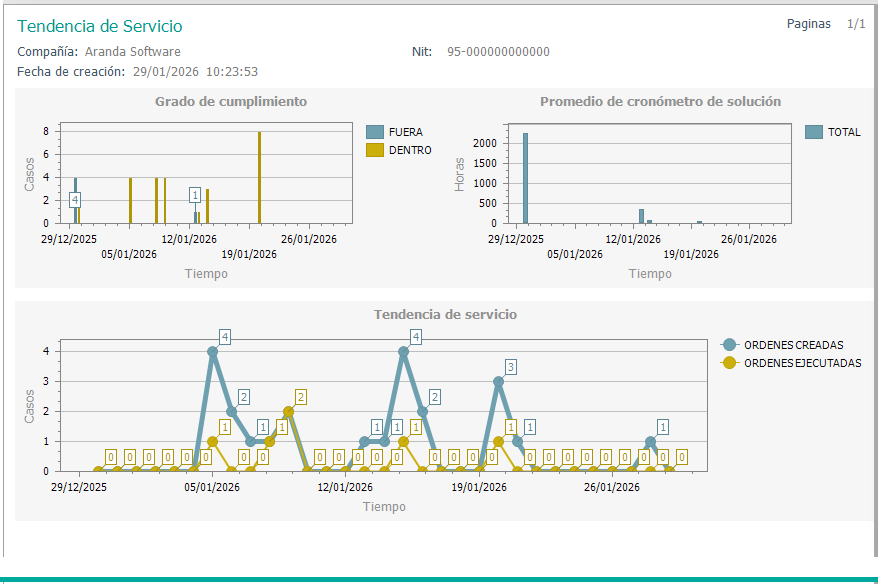
The report generates the trend of a service in a period, organized into three indicators: degree of compliance, average solution timer and service trend.
| Indicator | Description |
|---|---|
| Degree of compliance | This graph indicates the number of closed orders that are in or out of the solution SLA per service. |
| Solution Timer Average | This graph indicates the average time to solve all orders corresponding to the selected service and period. |
| Service Trend | This chart indicates the trend in the creation and closure of cases or orders corresponding to the selected service and period. This graph allows you to compare the number of orders created with the number of orders executed. |
Average Order Resolution Time Report by Service
The report generates a graph that indicates the total time (handling time and execution time) and the average resolution of all orders submitted.
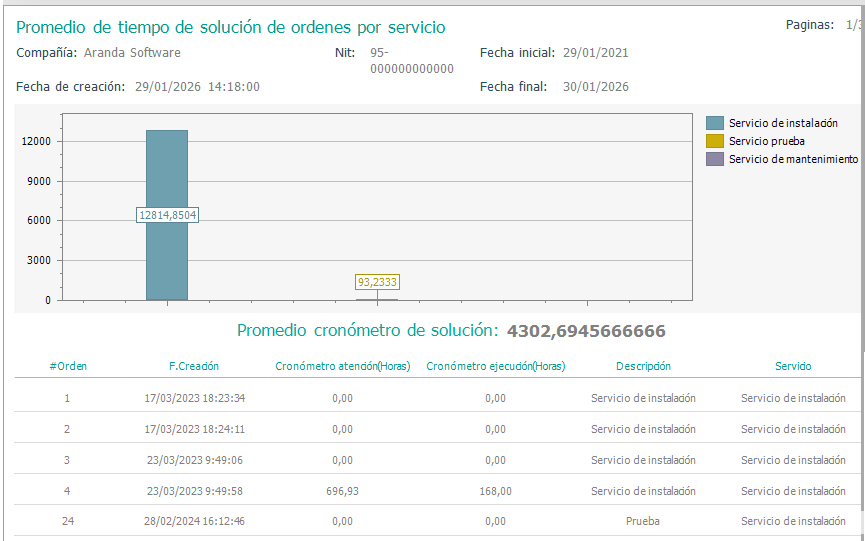
⚐ Note: If the service has no orders within the selected date range, the system will display a message indicating that there is no data for the configured filter.
Report of orders executed by specialist
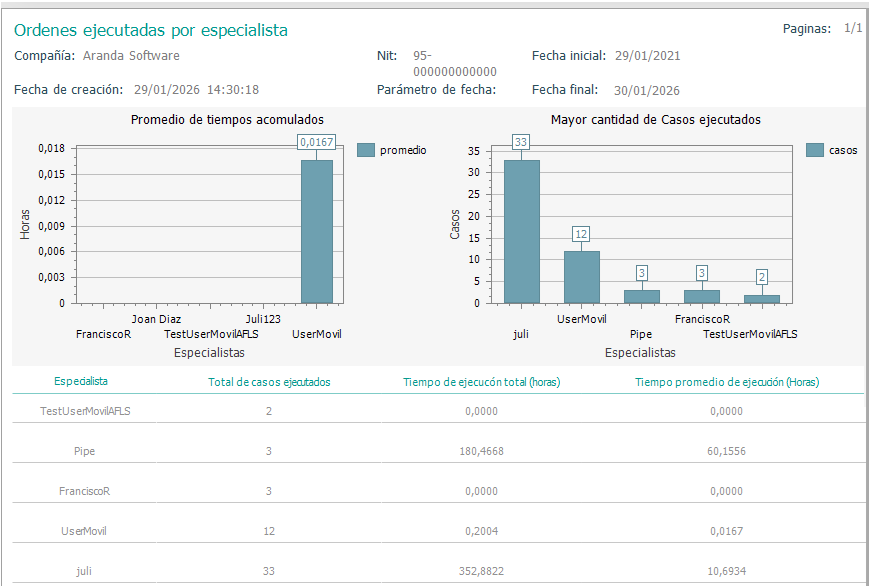
The report generates information on the execution time of orders by a specialist, organized into two indicators: Average accumulated times and greater number of cases executed.
| Indicator | Description |
|---|---|
| Average cumulative times | This graph indicates the average of the hours executed by each specialist for the selected service. |
| Increased number of cases executed | This graph indicates the number of cases closed by each specialist. |
⚐ Note: If the service has no orders within the selected date range, the system will display a message indicating that there is no data for the configured filter.
SLA Compliance Report
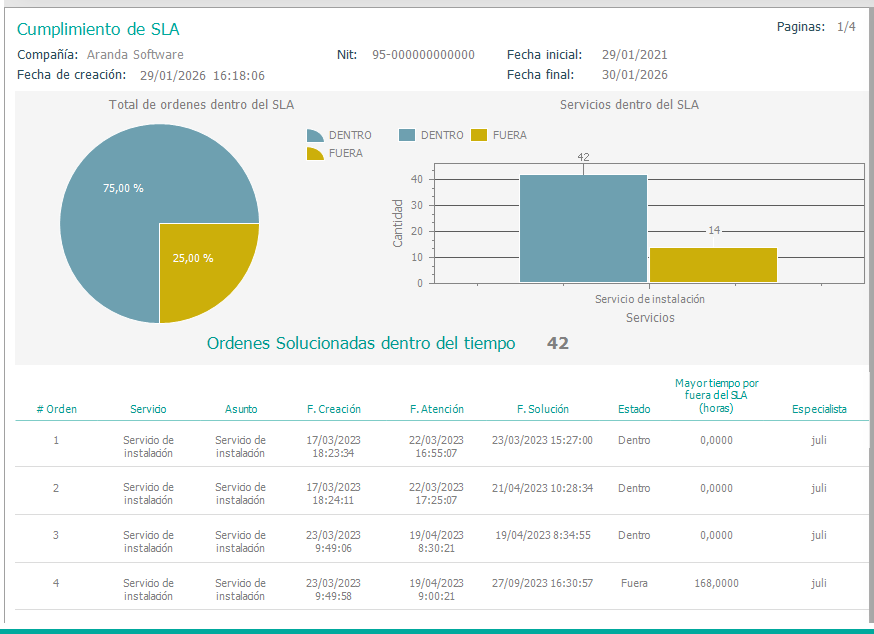
The report generates information on the number of orders created within or outside the solution SLA, organized into two indicators: Total orders within the SLA and services within the SLA.
| Indicator | Description |
|---|---|
| Total orders within the SLA | This chart indicates the total number of executed orders that are in or out of the solution SLA. |
| Services within the SLA | This graph indicates the number of executed cases that are within or outside of the per-service solution SLA. |
⚐ Note: The information presented depends on the filter configuration made. If there are more than 5 services, the graph will show the first 5 services with the most cases executed.
Satisfaction Level Compliance Report
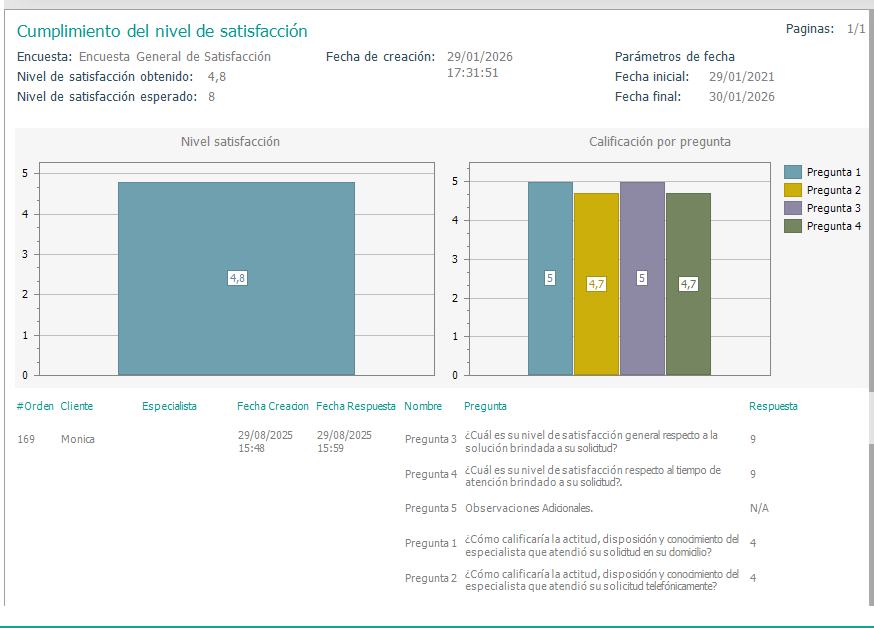
The report generates information from the general surveys answered by customers and presents the data in two sections: Satisfaction Level and Rating by Question.
| Indicator | Description |
|---|---|
| Level of satisfaction | This graph indicates the level of satisfaction obtained from the survey within the range of selected dates. |
| Rating by Question | This graph shows the questions that are grade type with their respective average. |
⚐ Note: If no surveys have been generated within the selected date range, the system will indicate that there is no data.
⚐ Note: Some of the questions may be of the grade type, but if they are not marked to count within the statistics, they will not be taken into account in the level of satisfaction obtained.